- 金币:
-
- 奖励:
-
- 热心:
-
- 注册时间:
- 2006-7-3
|
|

楼主 |
发表于 2009-5-10 18:48
|
显示全部楼层
Monday, June 05, 2006Another Bounce.....or Get Serious?
First, I apologize for the late posting. It's well past midnight here in California, and a combination of a busy day and Blogger's uploading capability being down for two hours contributed to burning the midnight oil.
The 200 point drop on the Dow Monday put a spring in my step. The market's behavior aligns nicely with what I'm been predicting. There's one particular daily market letter which, each day, puts in some bearish text and some bullish text and, the next day, puts in whatever was appropriate (after the fact) at the top of the new posting to make it seem like they were right on the money. No such games here. I'm going to always take the chance to state my mind about the market's direction.
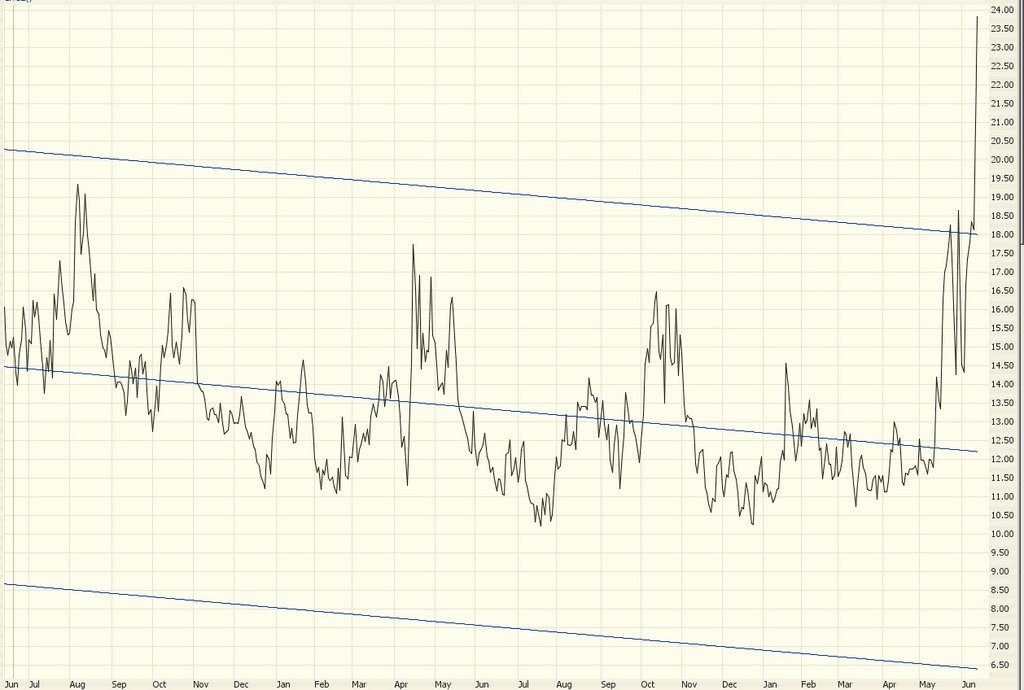
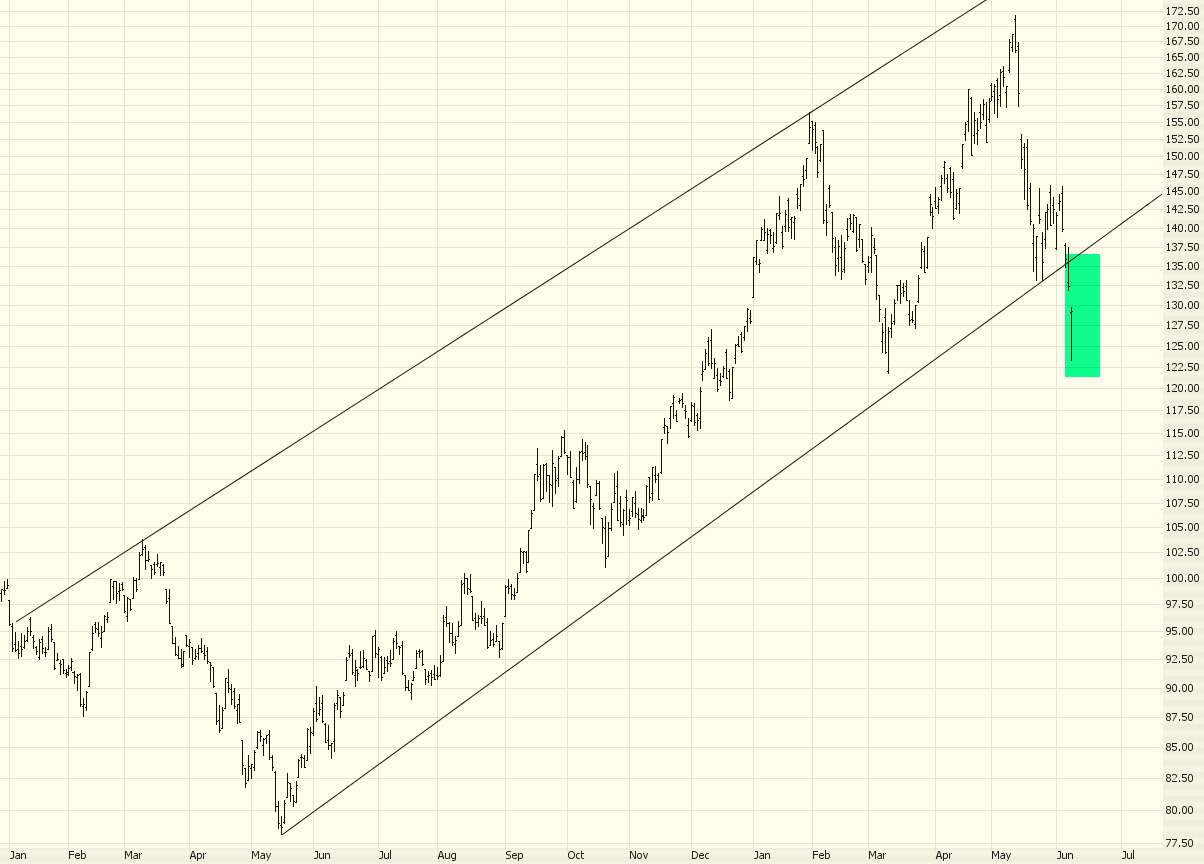
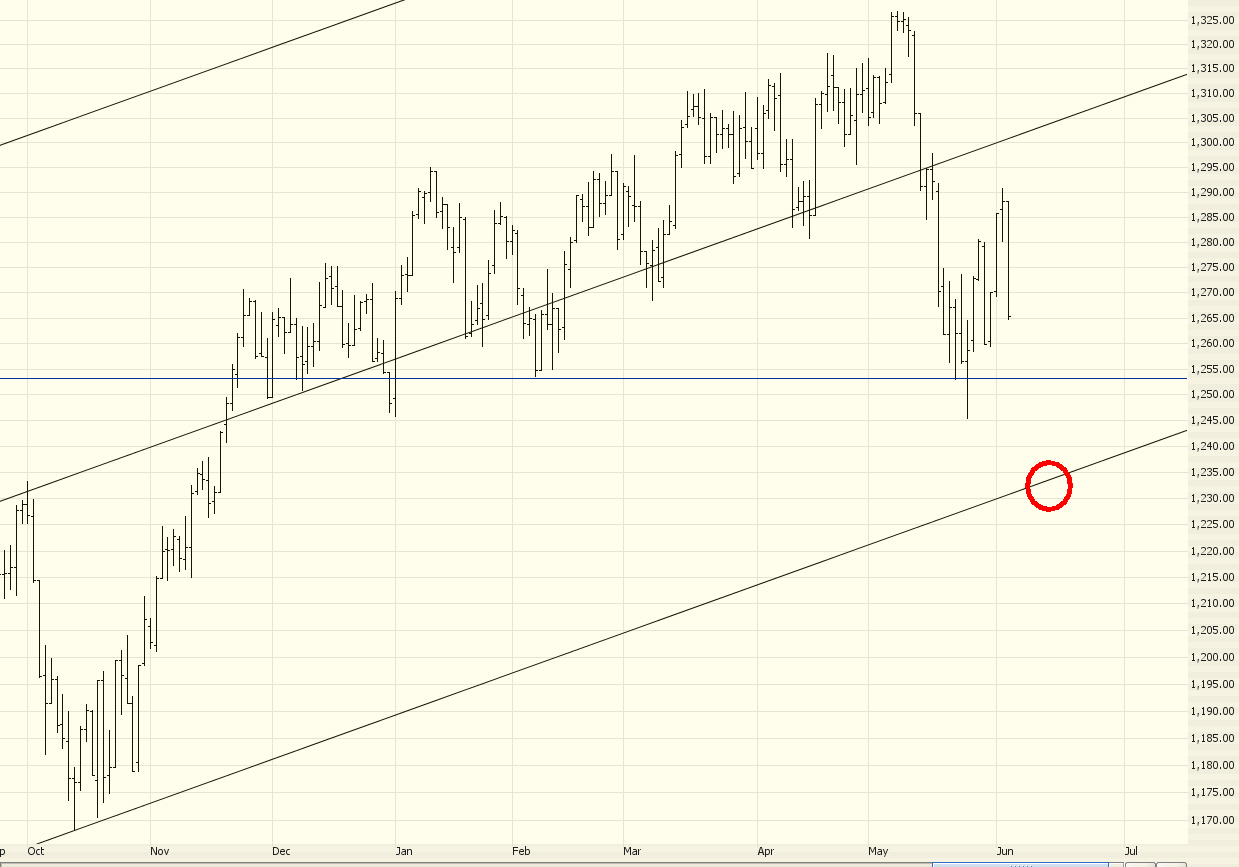
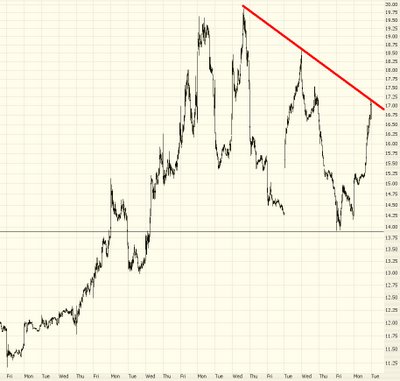
As much of a mega-bear as I am, I'm still not ready to start waving the Flag of Doom yet. There's a reasonable chance of a bounce tomorrow (which would be a real drag, since these stupid bull bounces get really boring and tiresome; and they seem like a waste of time to me, since it seems we should get to the real business of a market wipe-out instead of all this pussyfooting around). The $VIX is shown below on an intraday basis. As the red line indicates, we bumped up against resistance today. The VIX really needs to cut through this line before it can move appreciably higher.
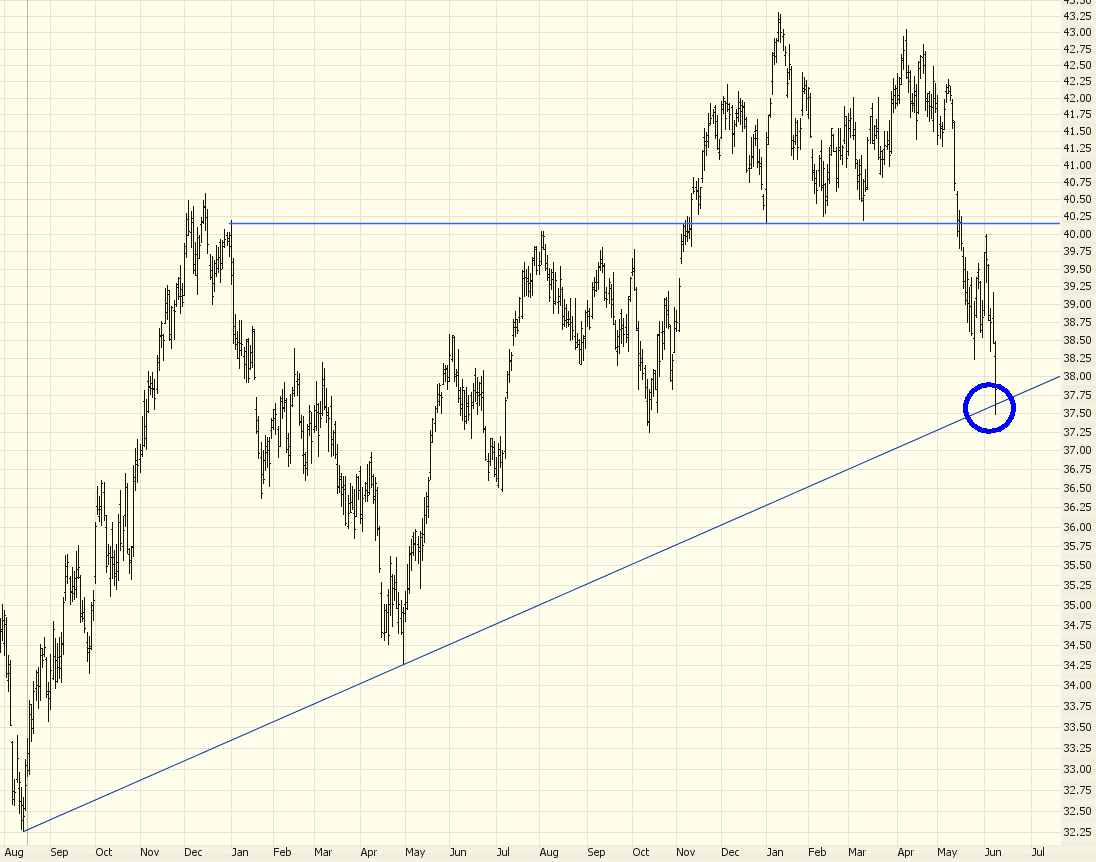
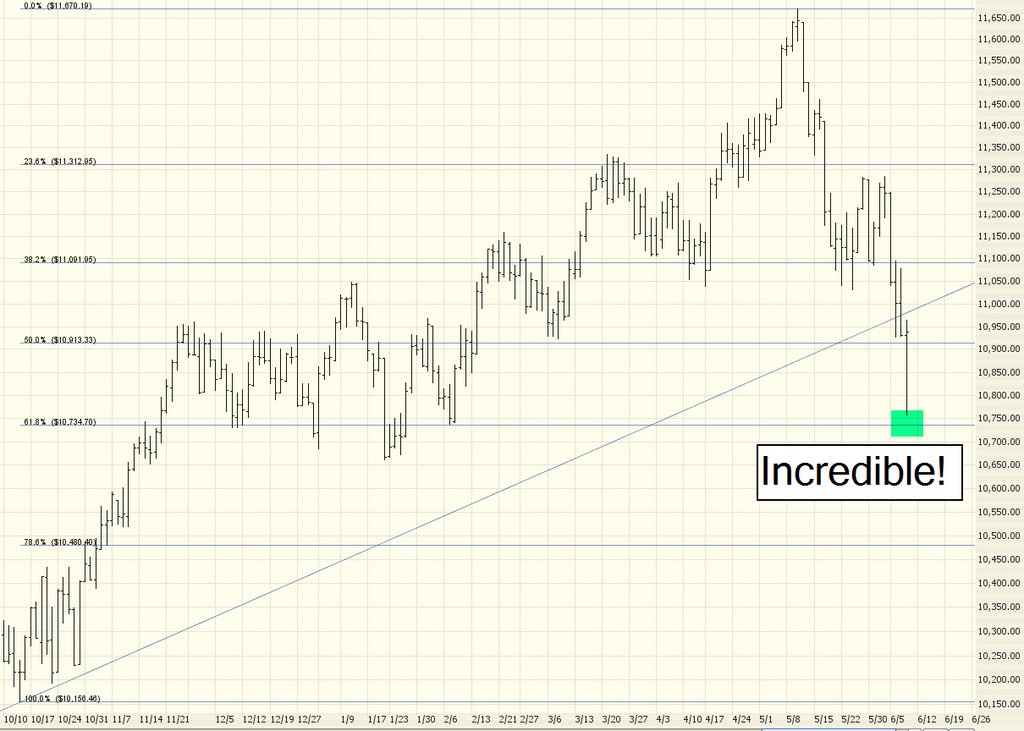
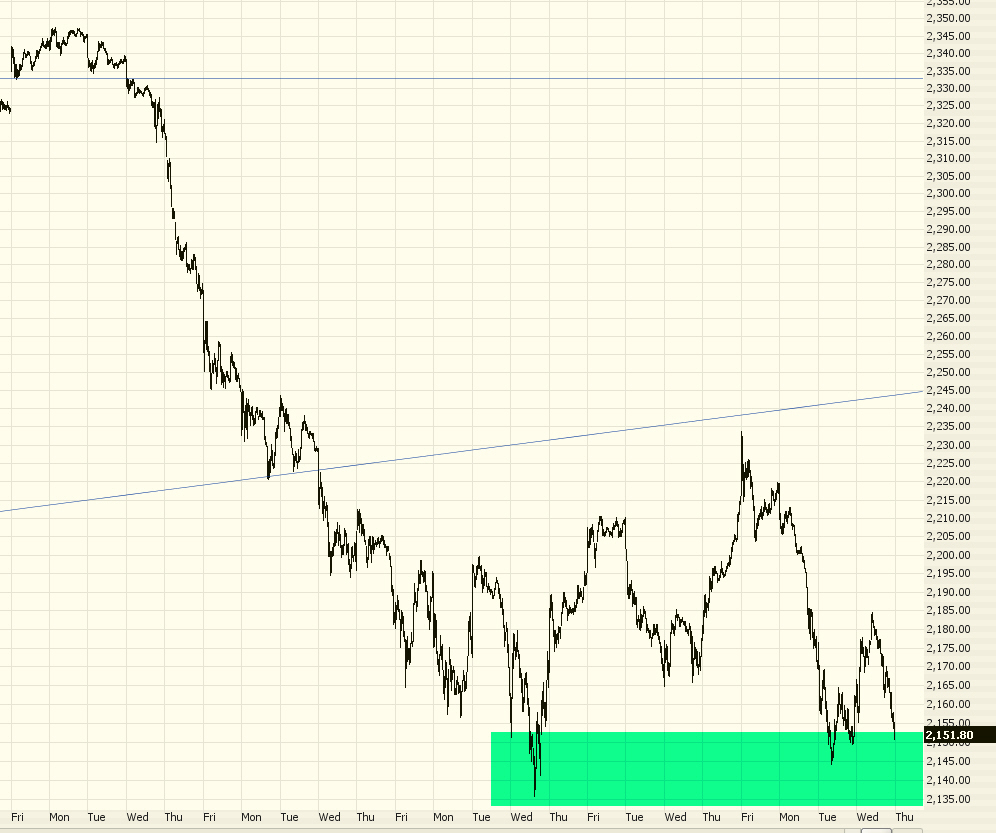
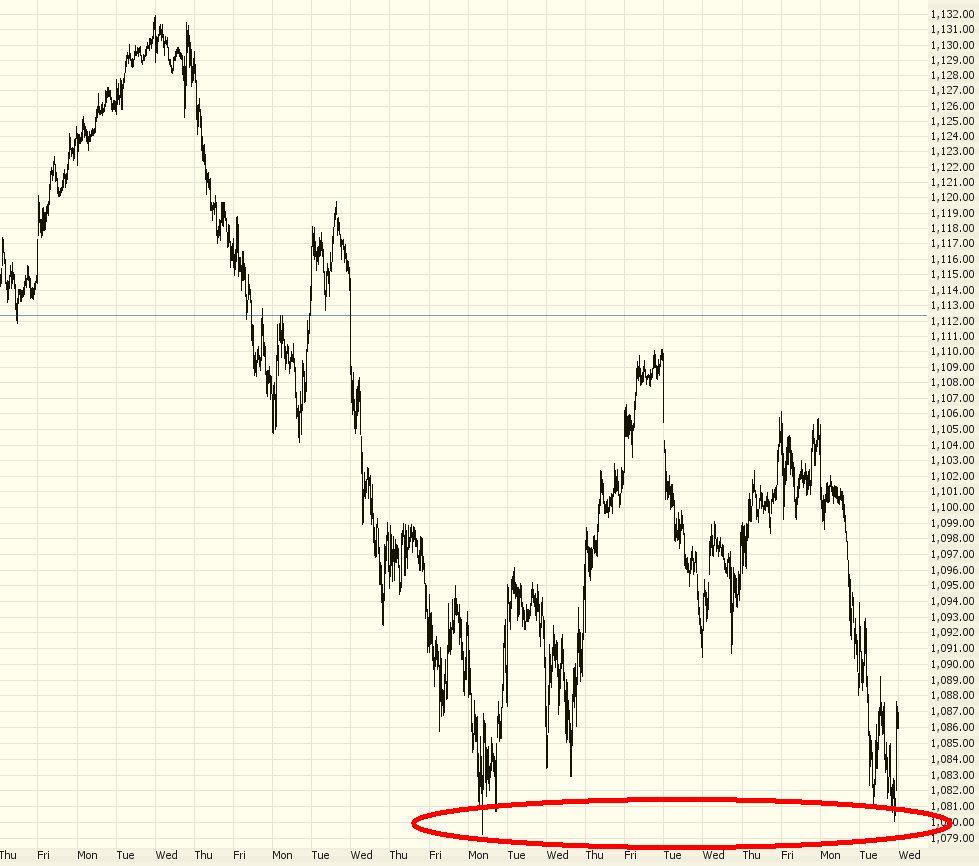
But the action over the past couple of weeks has been superb. Look at the NASDAQ Composite below. A break, a retracement, and then a fall again. Beautiful.
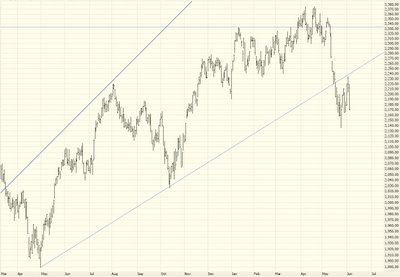
Here's a closer look at the NASDAQ so you can see in greater detail the textbook performance (the newbies out there: you can always click any of these images to see a bigger version).
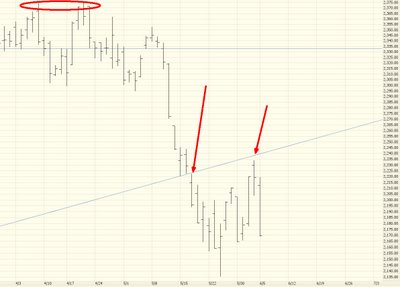
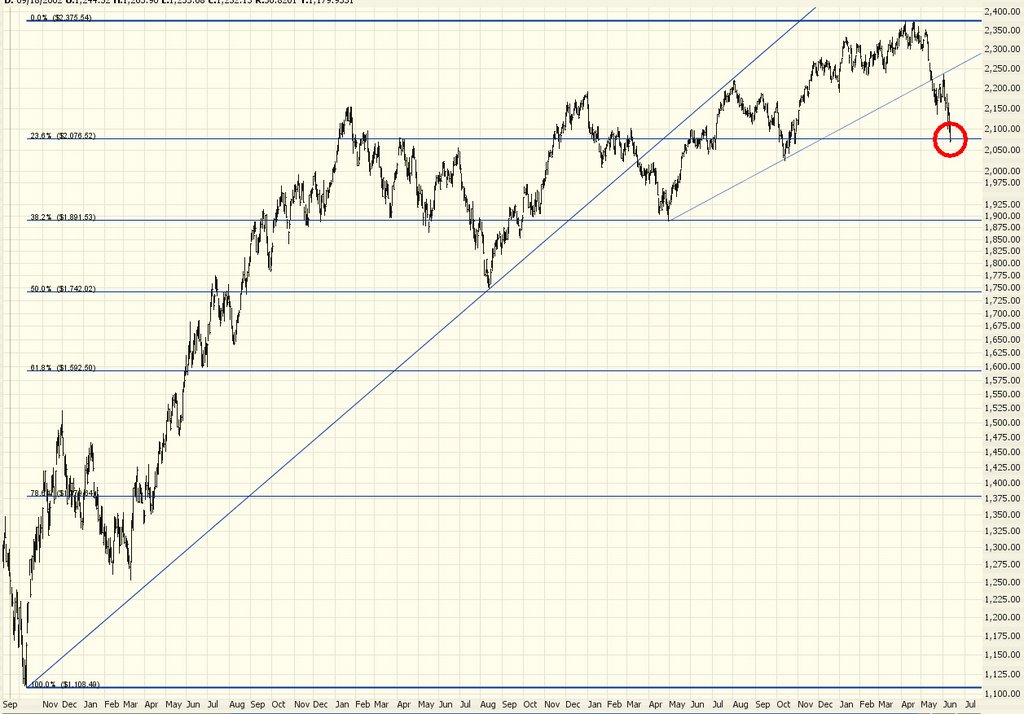
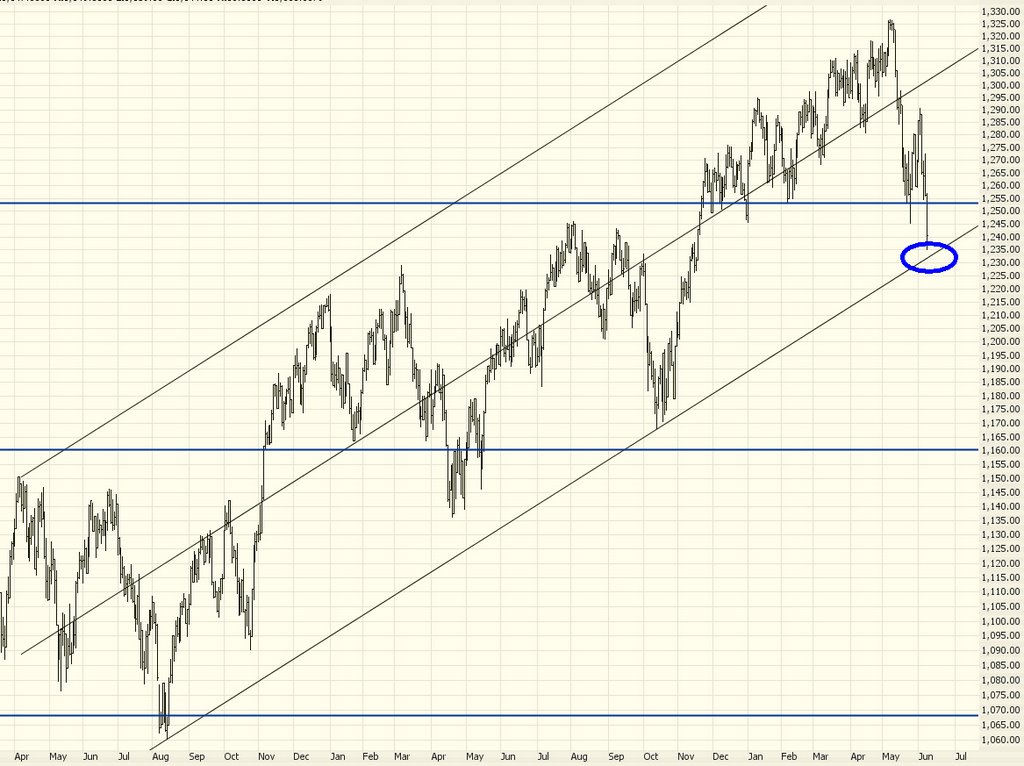
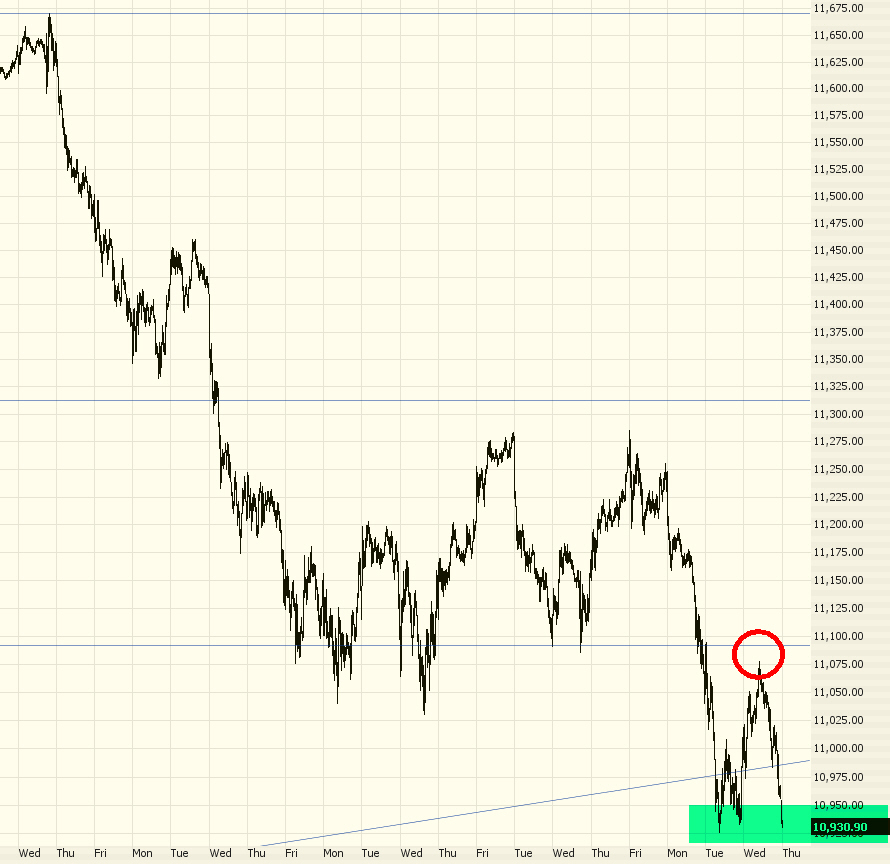
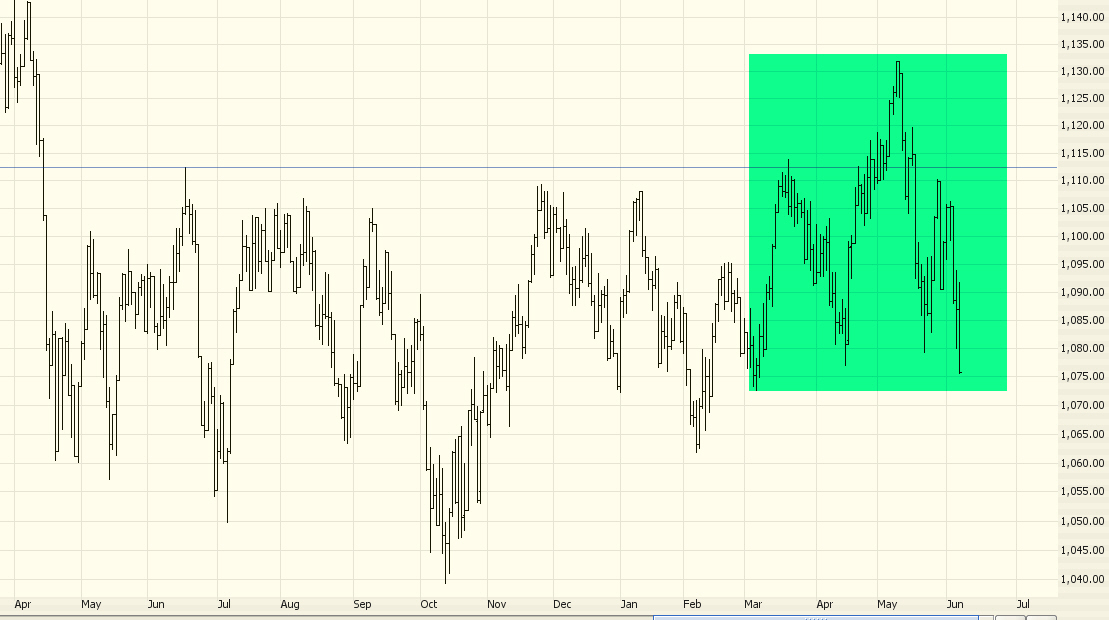
The Dow 30 is right on the cusp of completing its head and shoulders pattern. It's not the most massive H&S I've ever seen, but it fits the definition. If it breaks the neckline, we could see this heading to the green area I've shaded. As it is, I'm thinking it'll at least push down toward the circled red area, which is roughly where the supporting trendline would hit the price action.

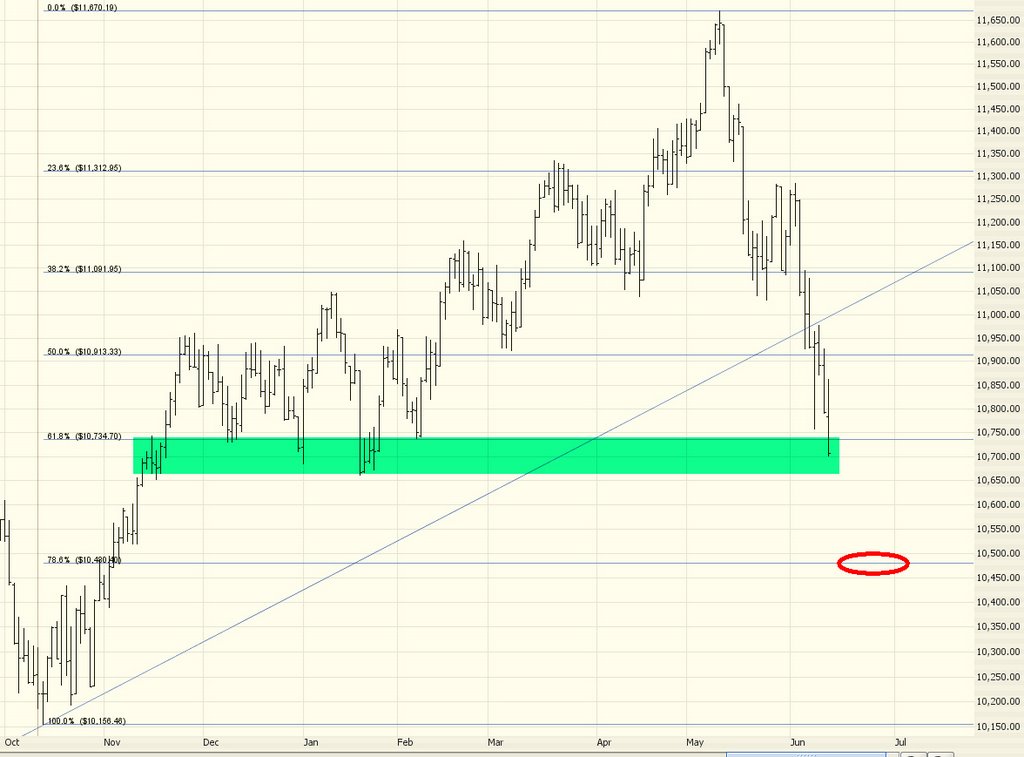
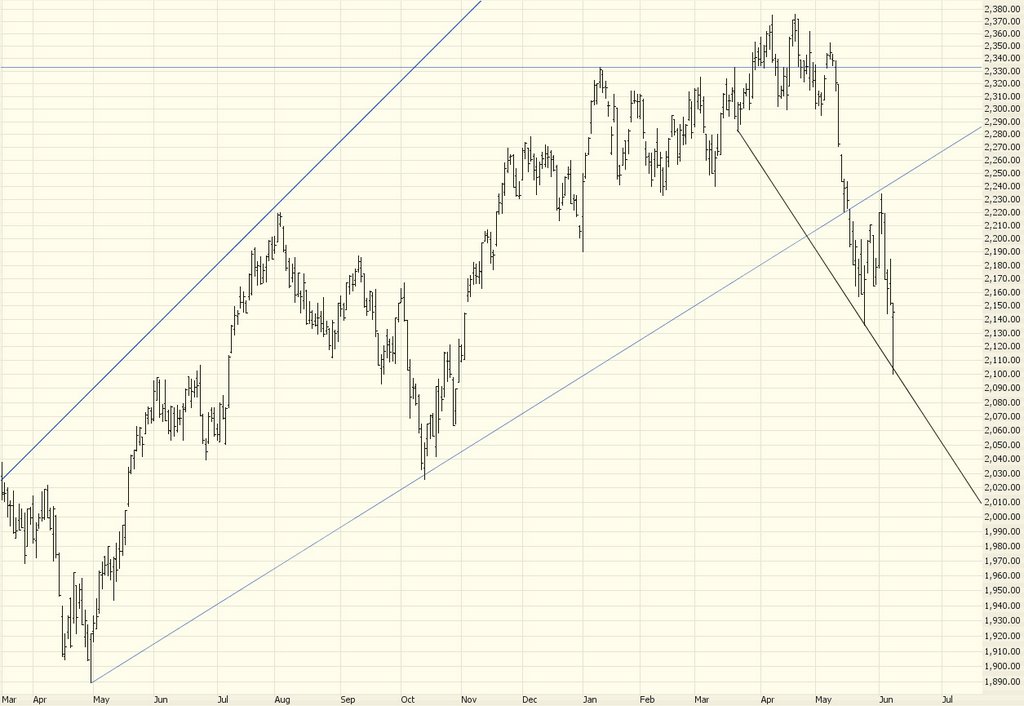
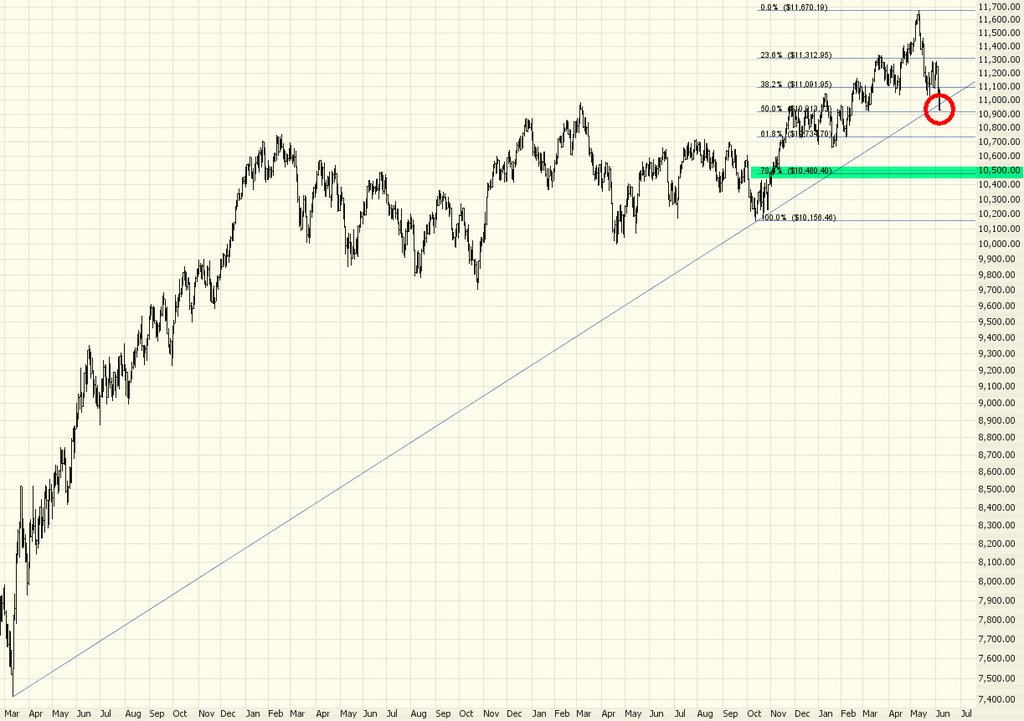
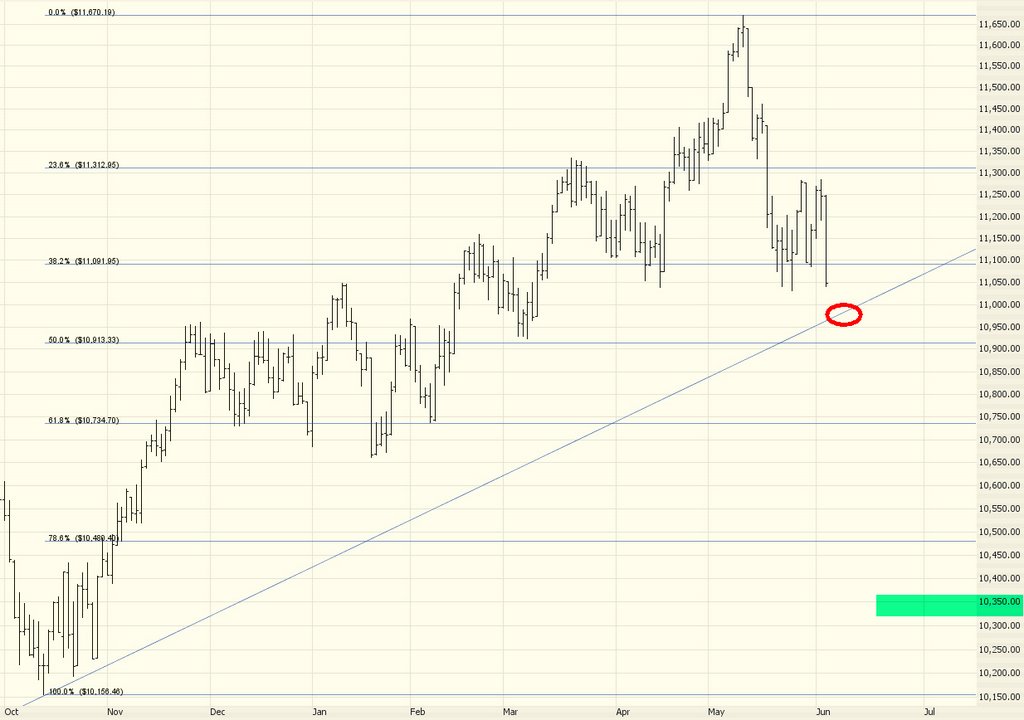
The Russell 2000 likely has an easy target on its supporting trendline. As I've pointed out before, notice how the most recent pattern was a rounded top (bearish) as opposed to the three saucers before (bullish). |
|
|
 [复制链接]