- 金币:
-
- 奖励:
-
- 热心:
-
- 注册时间:
- 2006-7-3
|
|

楼主 |
发表于 2009-5-10 21:31
|
显示全部楼层
Wednesday, May 24, 2006Ready to Bounce?
Finally, the market was able to hold its act together until the close to post a small gain (on the Dow, at least). At 1:34 p.m. the markets seemed to be really falling to pieces, but it reversed and shook off part of the damage. It may be that, at last, a bounce is at hand (unless the GDP tomorrow morning at 8:30 EST is a surprise).
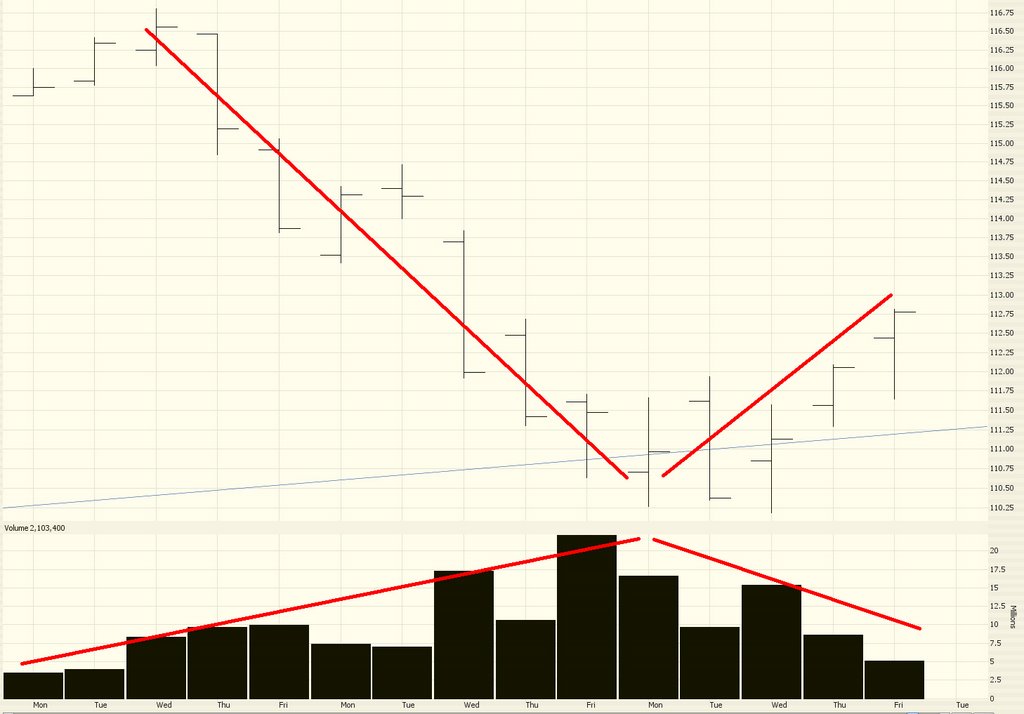
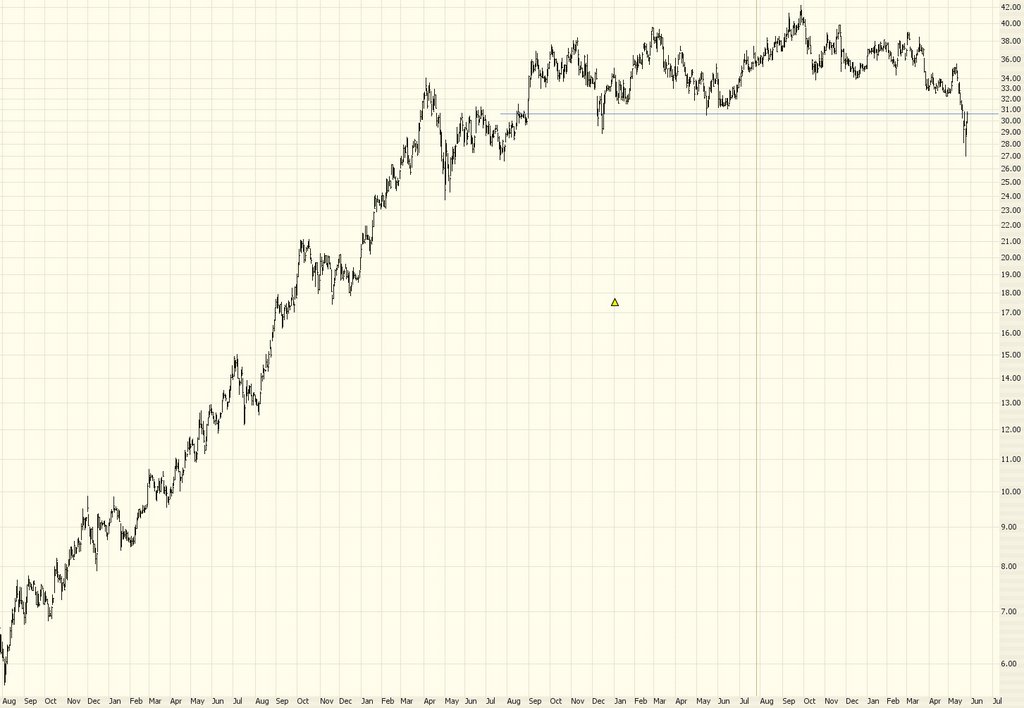
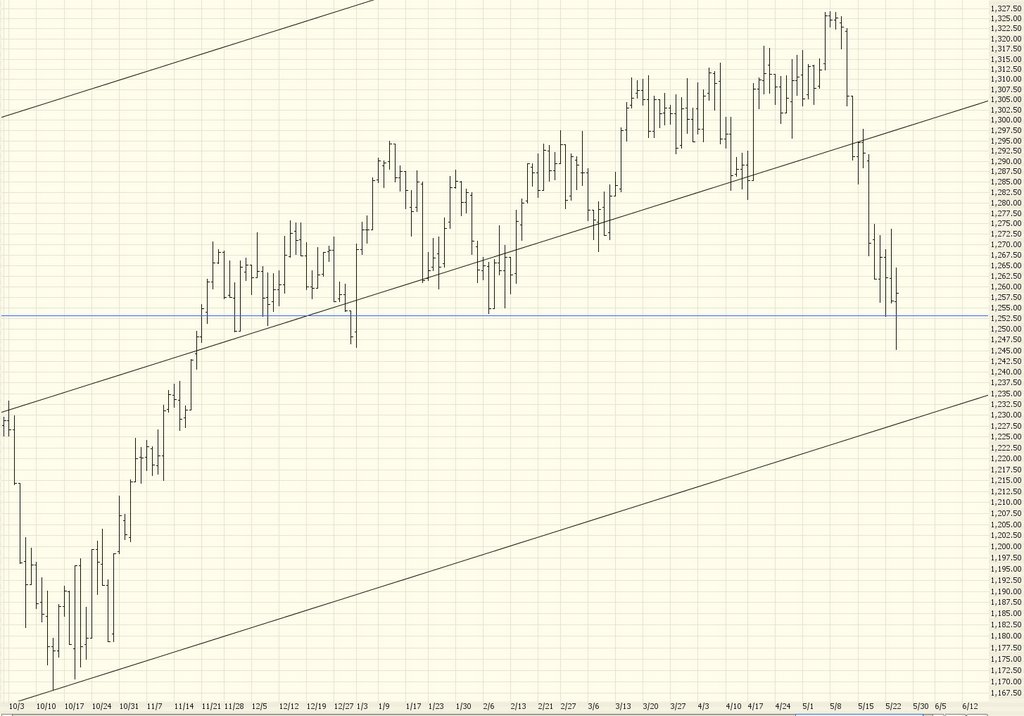
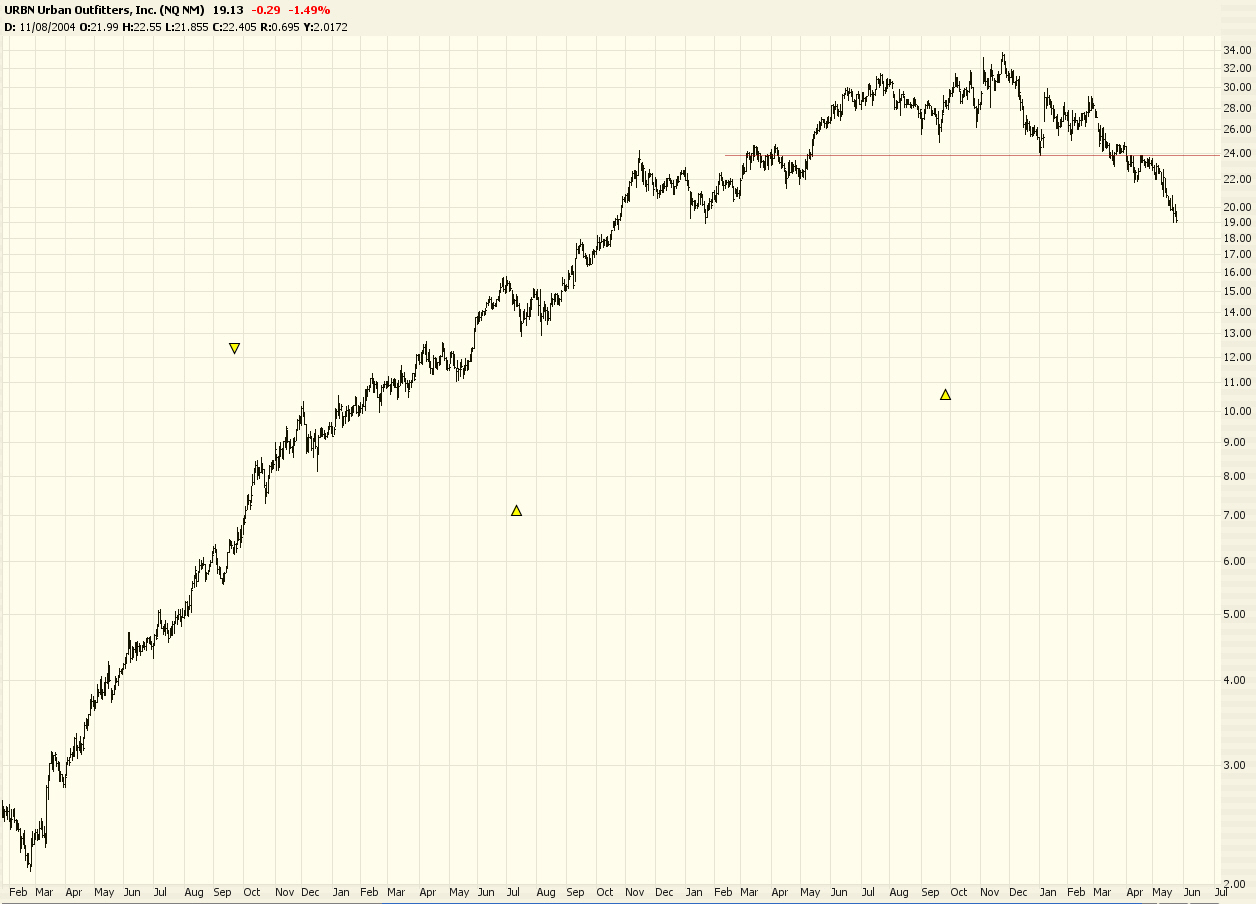
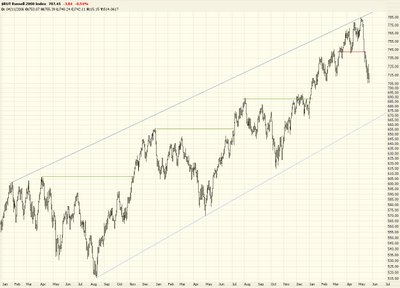
Below is the Russell 2000. The fascinating thing to me, and what tells me we've "gone bear" is this - - notice how before the market would form a saucer and launch from there (the prior three horizontal lines). Now the saucer is in a rounding top form, and the prices fall from that. So prices are mover lower away from patterns instead of higher. I like that.
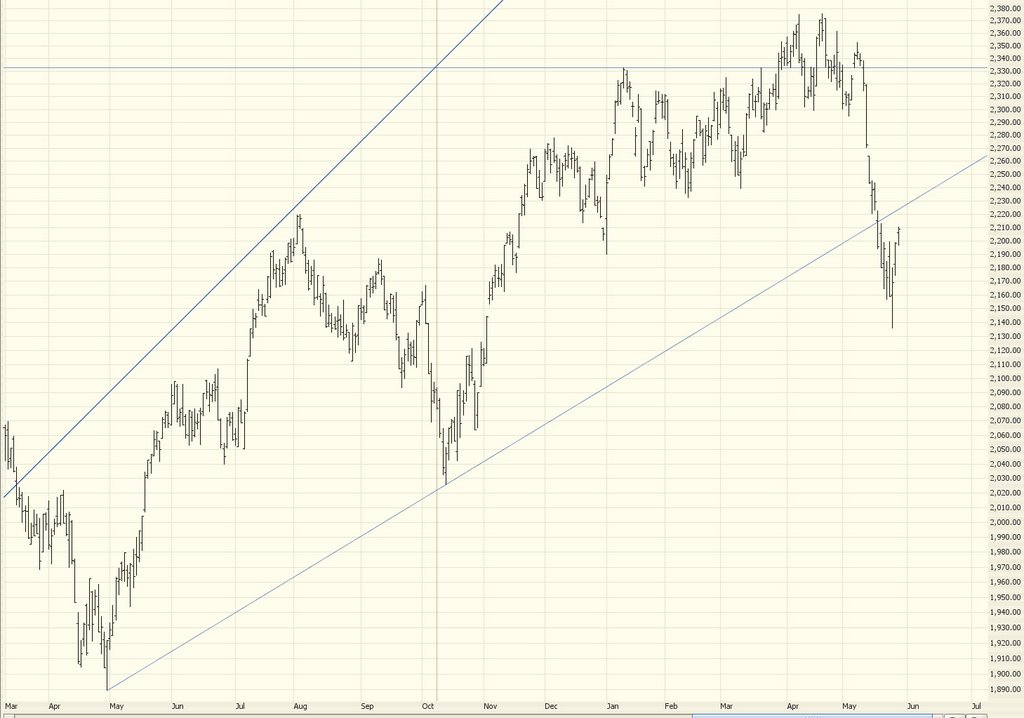
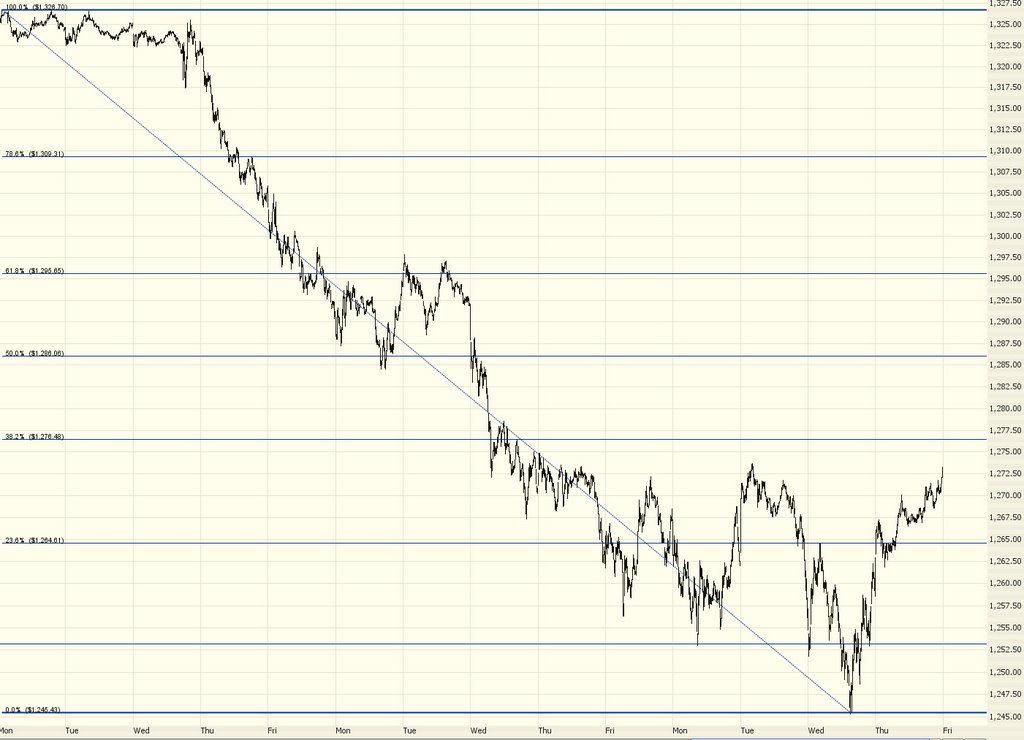
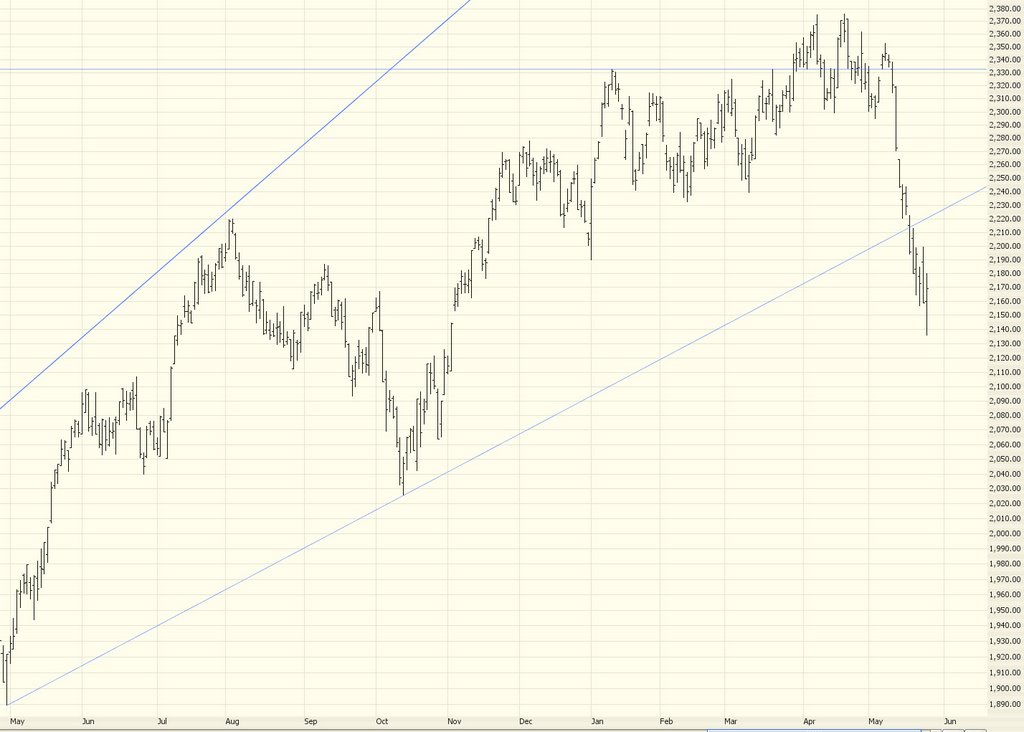
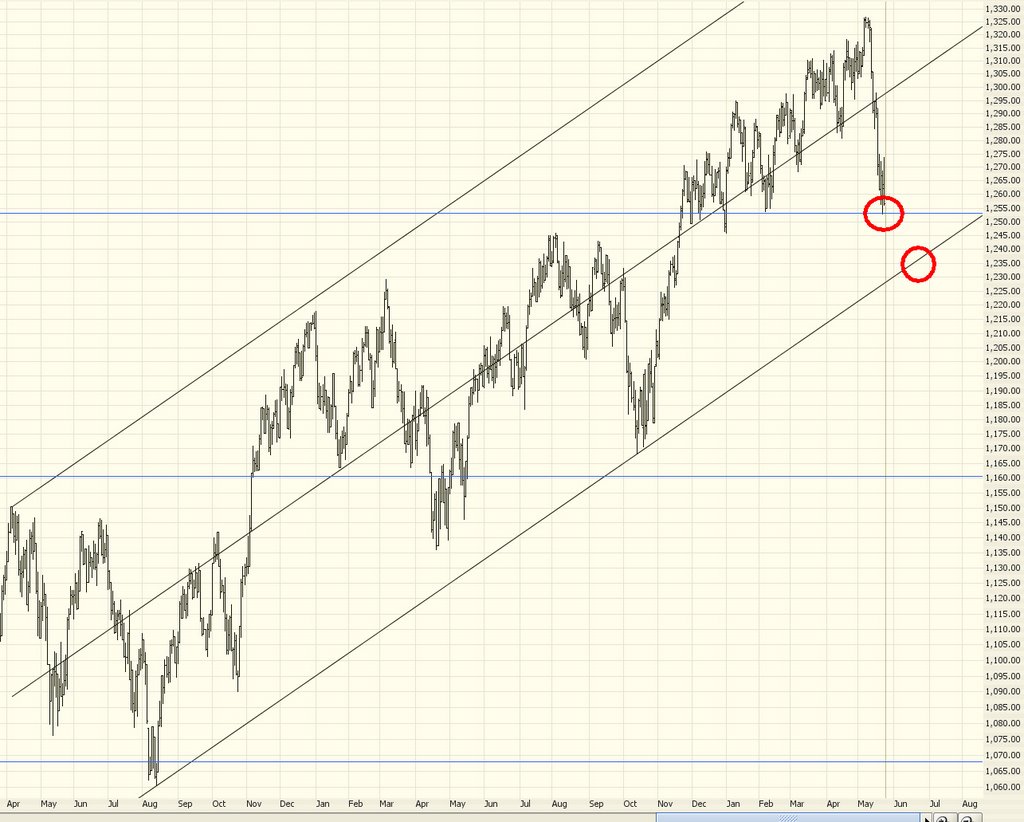
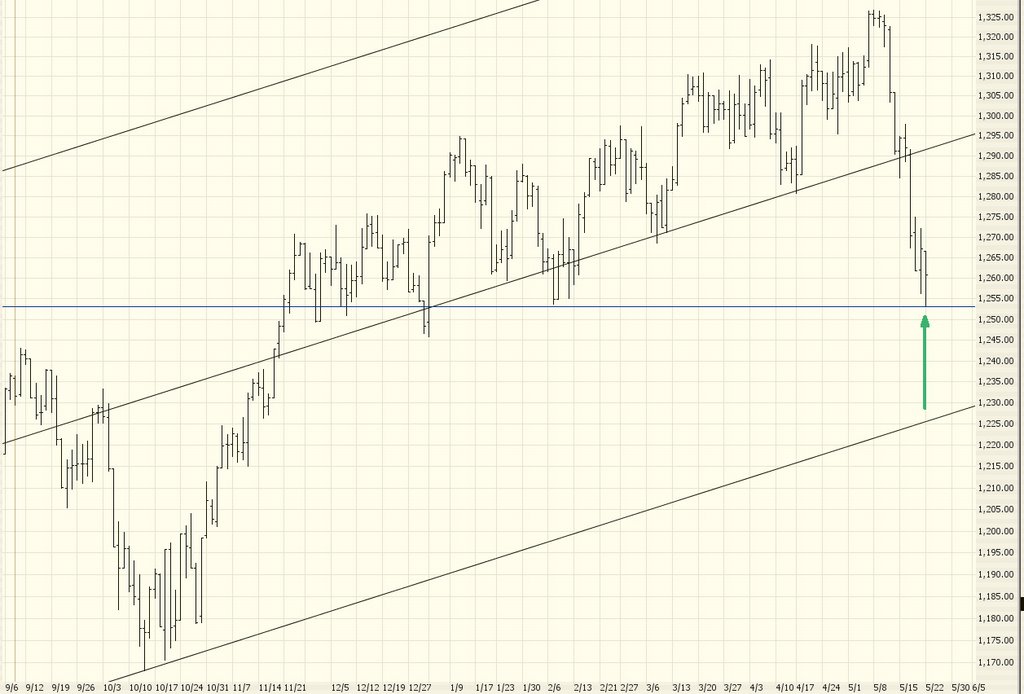
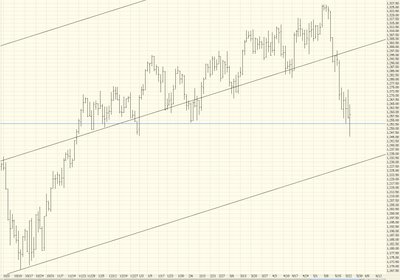
But the market has fallen hard and fast, and I would feel a little better about this whole thing if we could push back up against resistance levels, giving us bears some fantastic short opportunities. Here's a close-up of the S&P 500. As you can see, it's got plenty of upside room to push up against that median line and a relatively small amount of room to fall down to that support line.
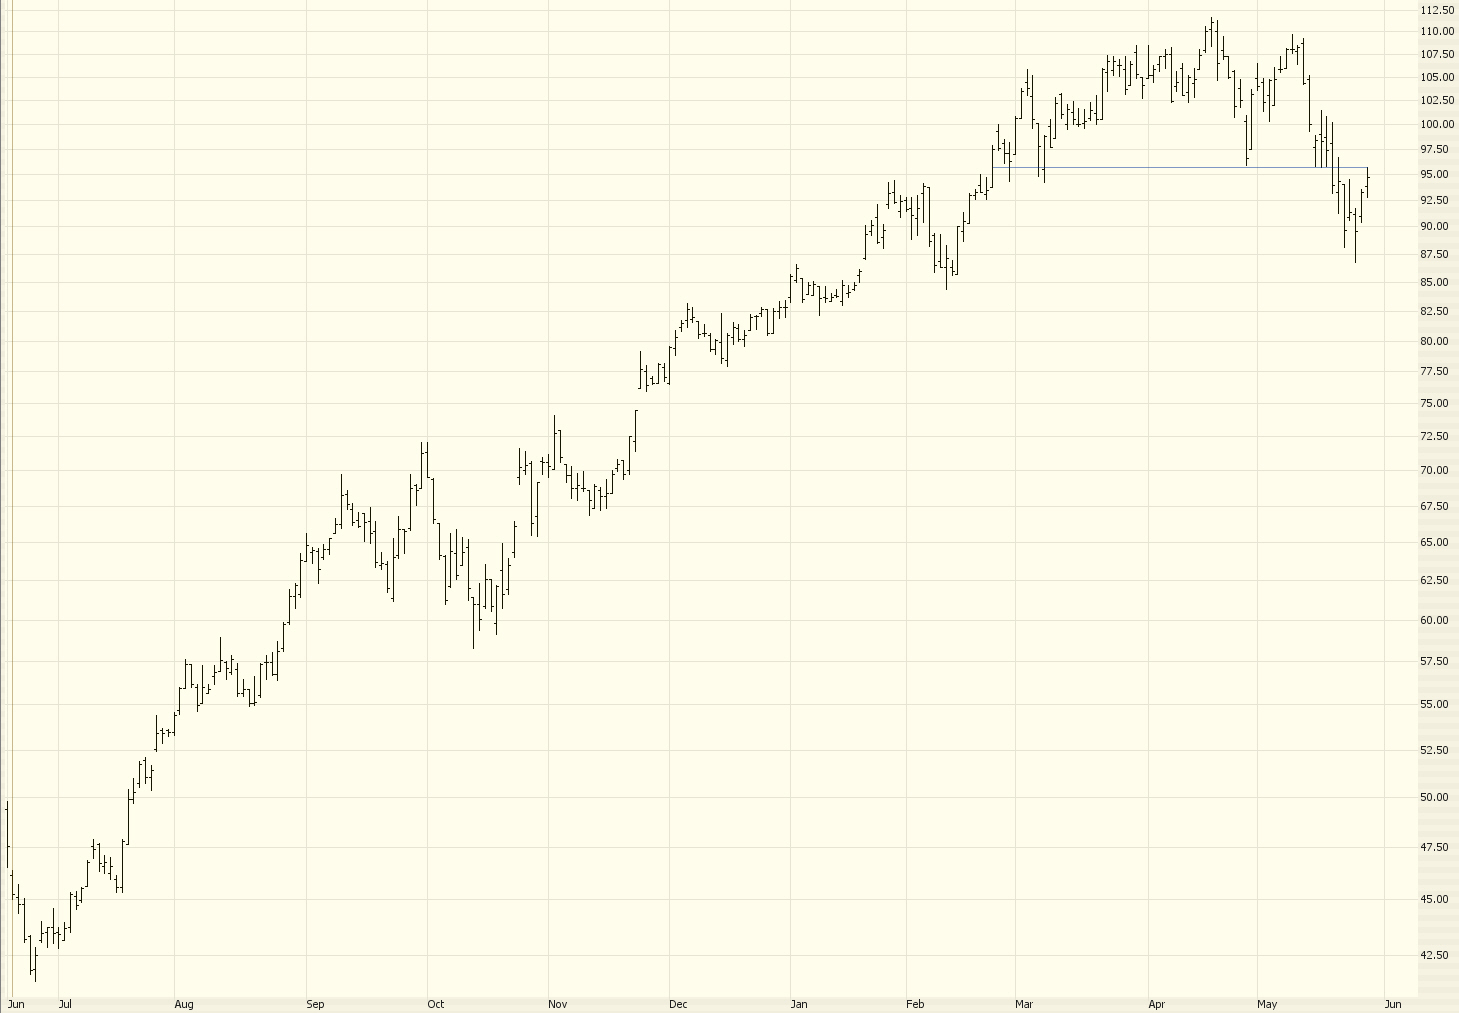
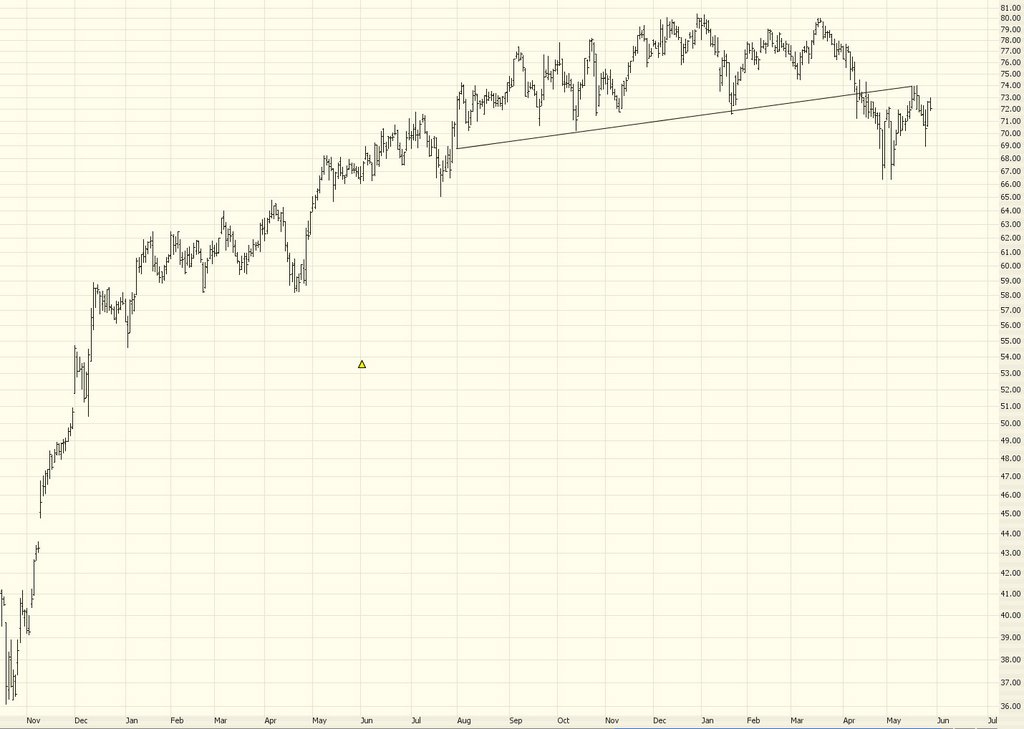
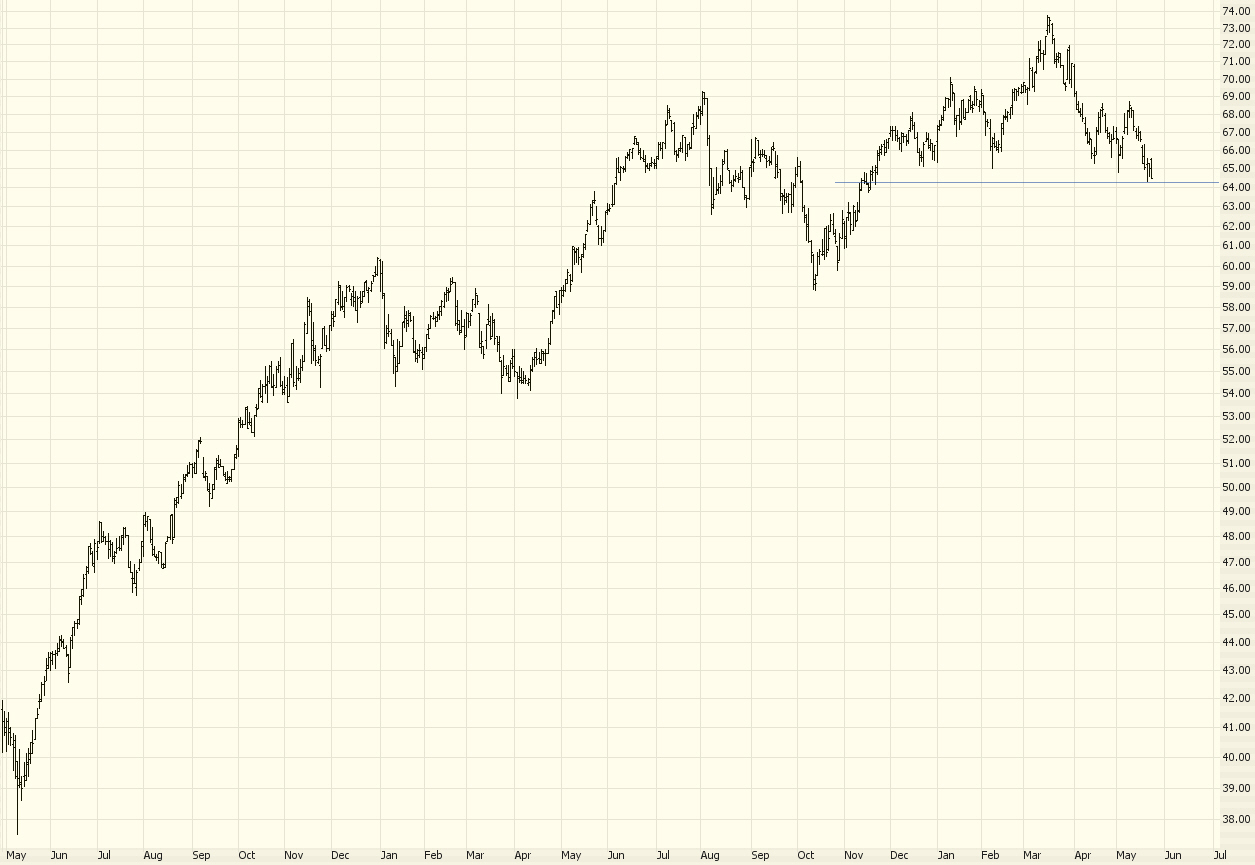
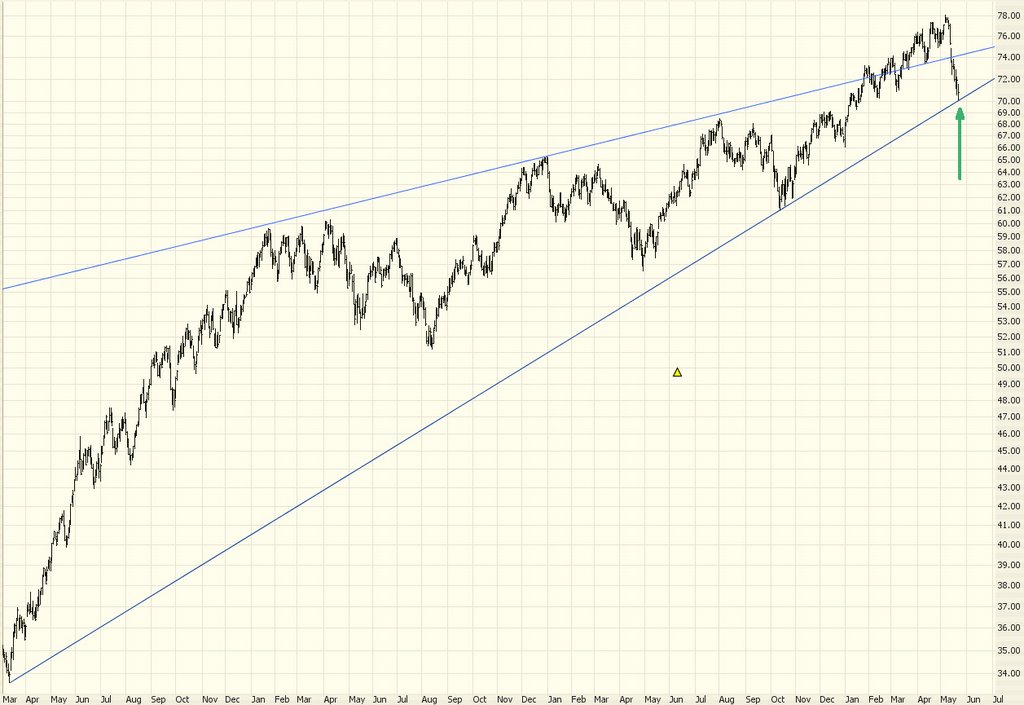
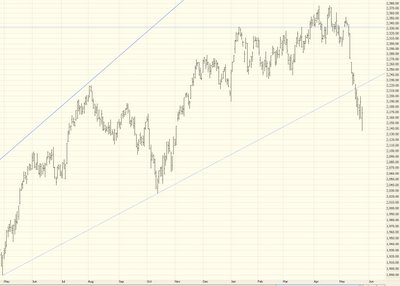
A similar argument can be made for the NASDAQ, which seems to have firmed up the best today from its earlier losses.
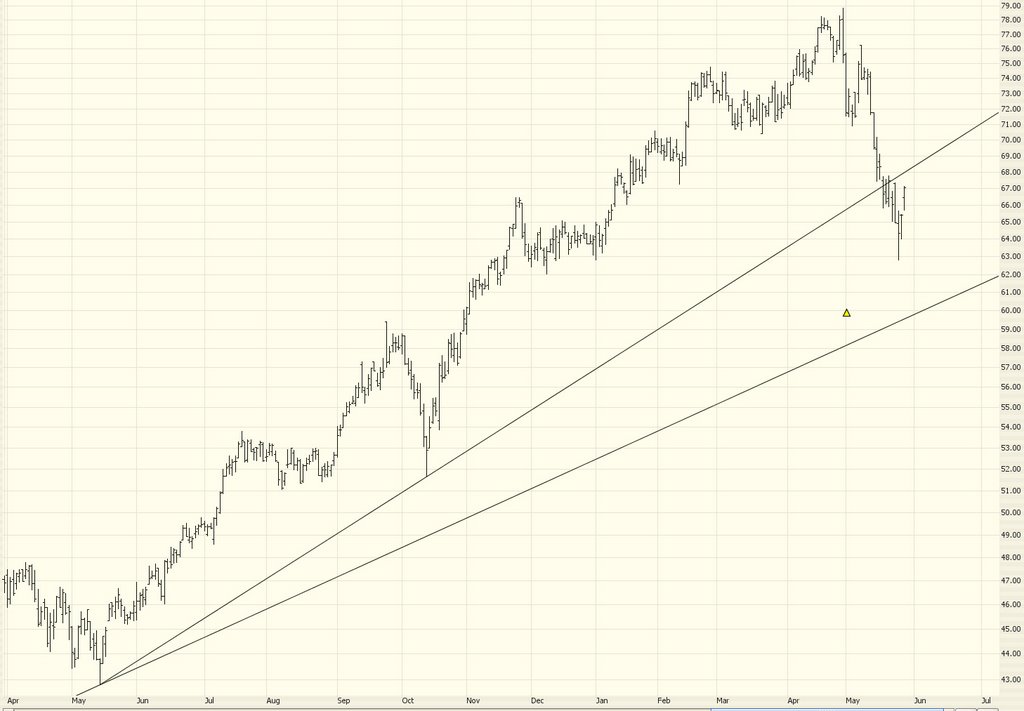
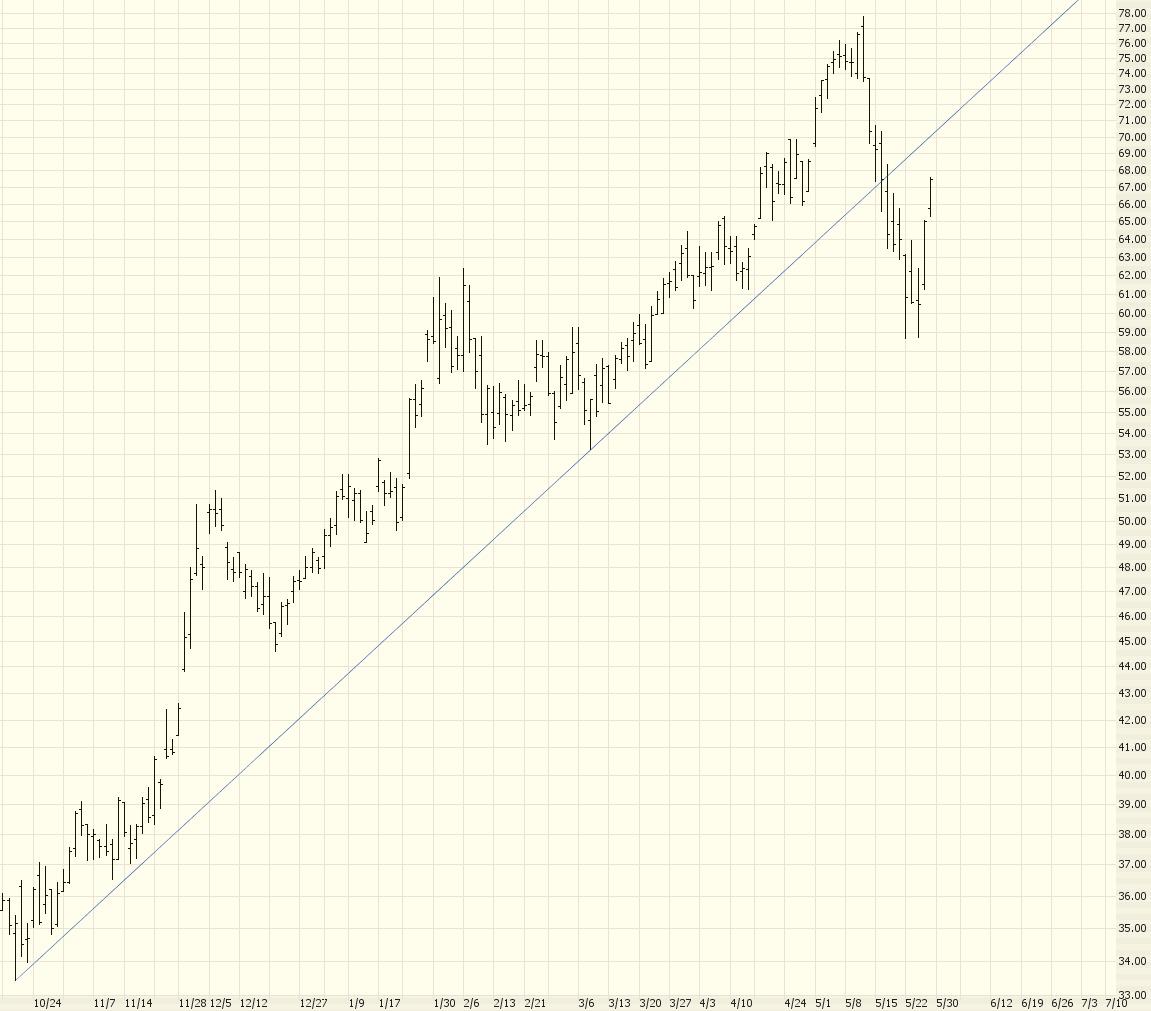
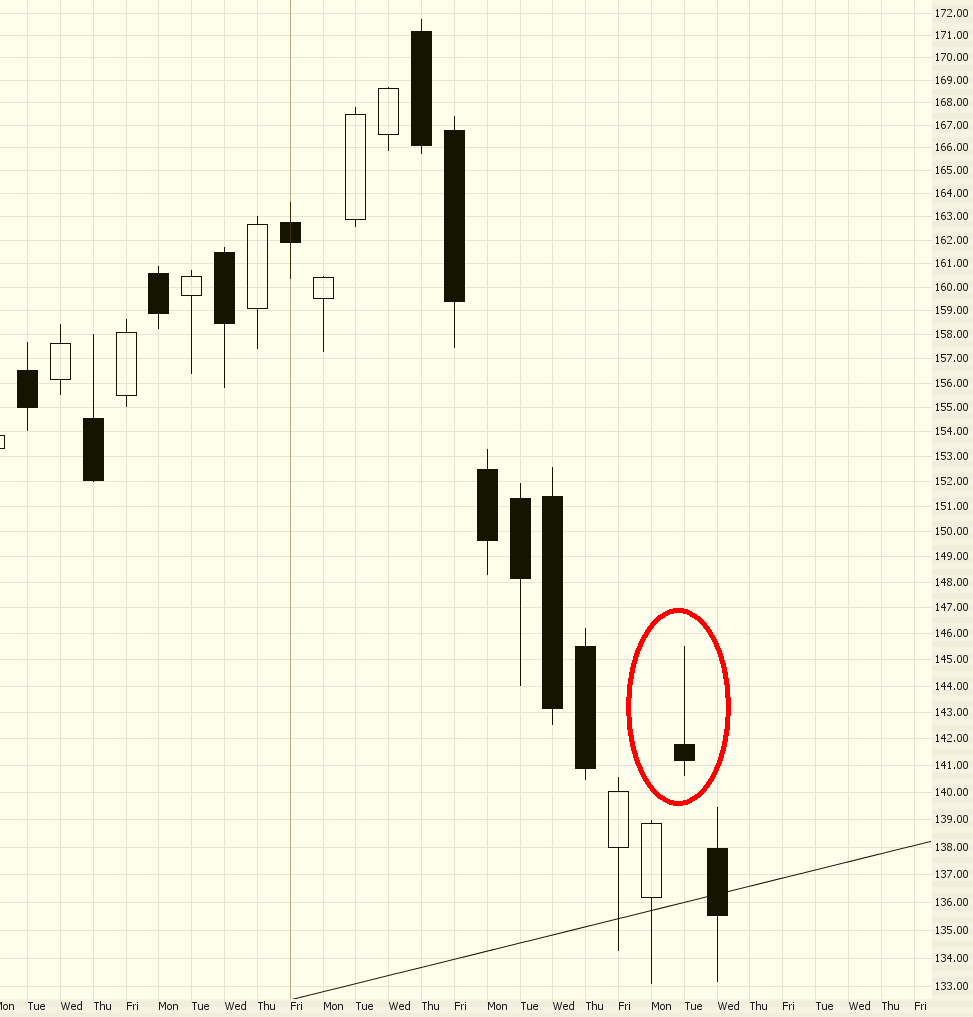
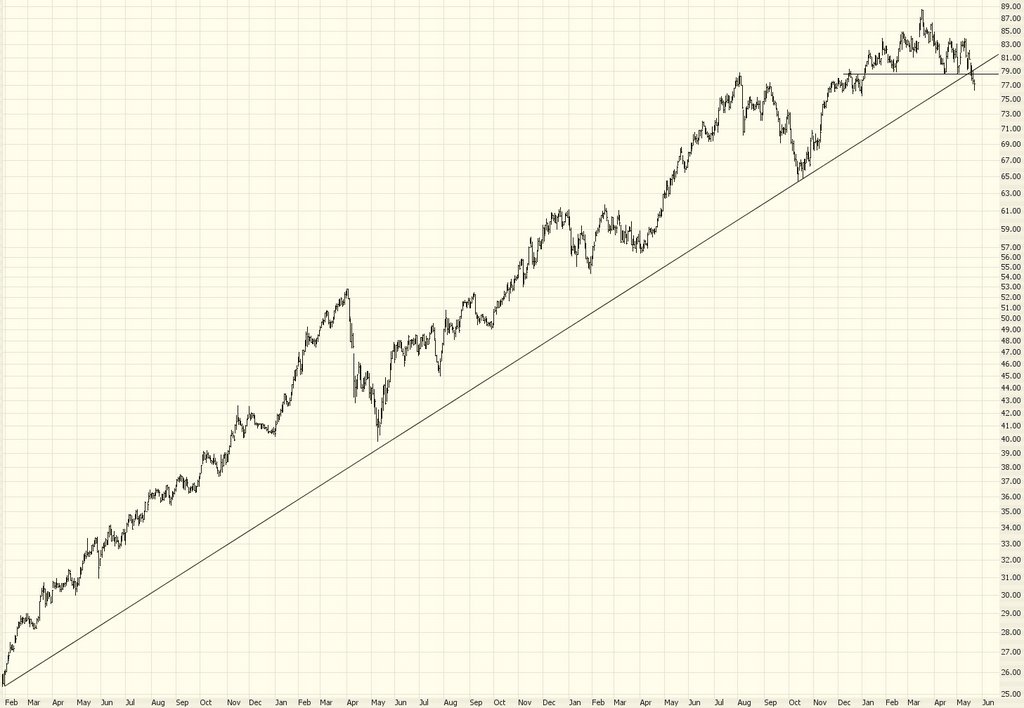
One interesting chart was the Oil Services sector (OIH). This pattern, if it appeared at the top of a stock's price action, is called the abandoned baby, and it's rare and very bearish. I'm not so sure it means anything when it's in the middle of price action, since clearly this isn't the very top. |
|
|
 [复制链接]