- 金币:
-
- 奖励:
-
- 热心:
-
- 注册时间:
- 2006-7-3
|
|

楼主 |
发表于 2009-5-9 15:33
|
显示全部楼层
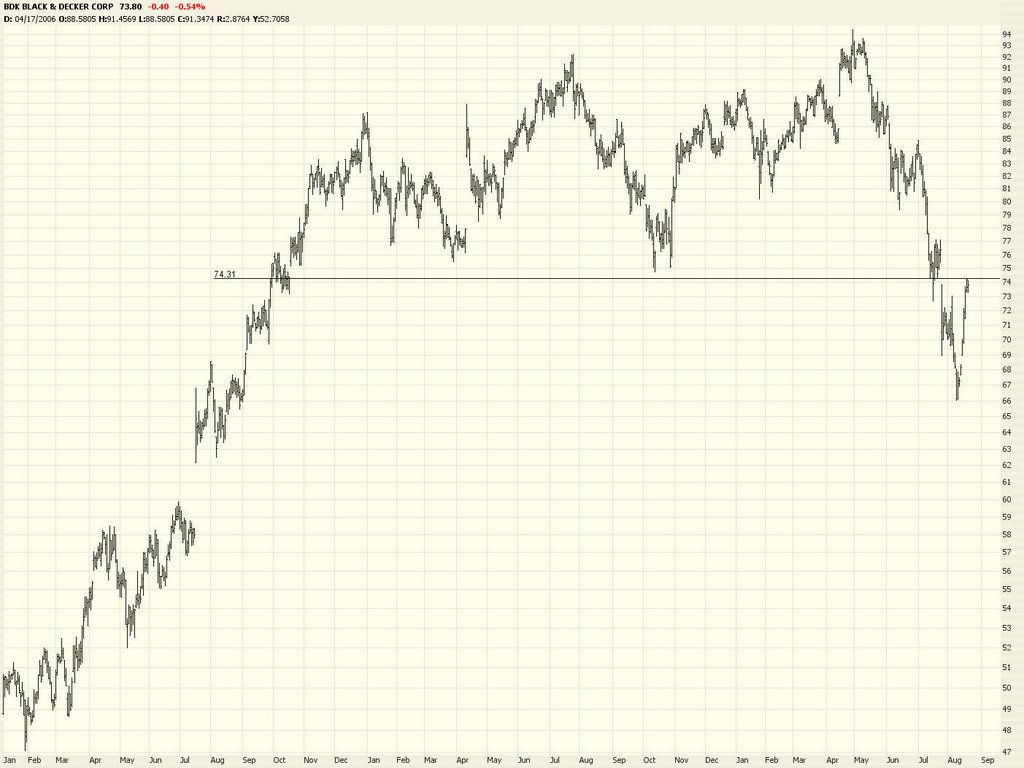
Friday, August 18, 2006How Much Longer?
Strength begets strength. Today the markets continued to push higher. Most of the push was left for the end of the trading session - perhaps today being an options expiration was a factor here. In any case, thus ends a nasty week for the bears.
I wonder how long this push upward will continue. We are, across the board, getting to some dangerously high levels which, if pierced, stab at the heart of the bearish arguments. I feel as confounded as I was in 1999 when everyone on the planet seemed to be a bull.
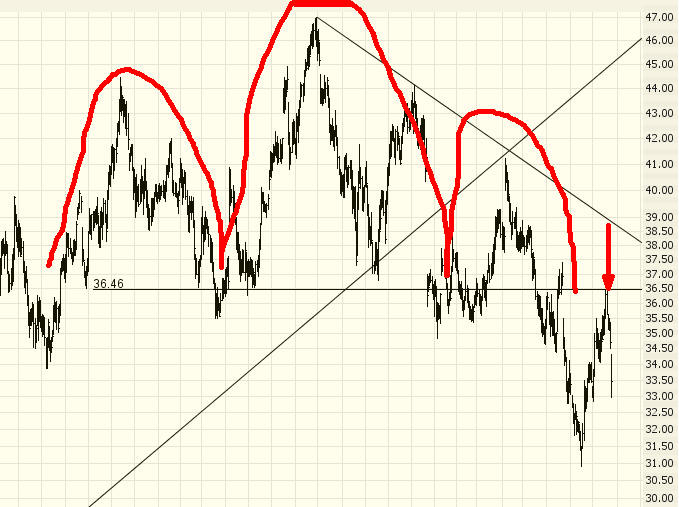
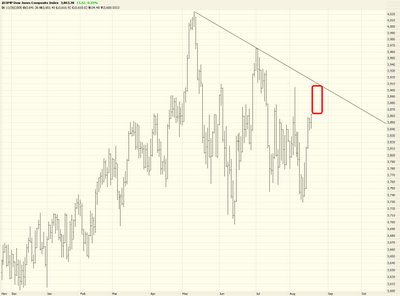
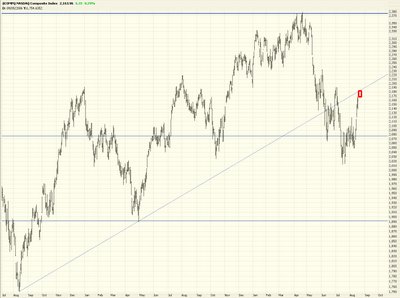
Let's take a look at some major indices and how much room is left to surge on each before they do major damage to some bearish trendlines. First, the Dow Jones Composite. The rounded rectangle indicates how much wiggle room is left:
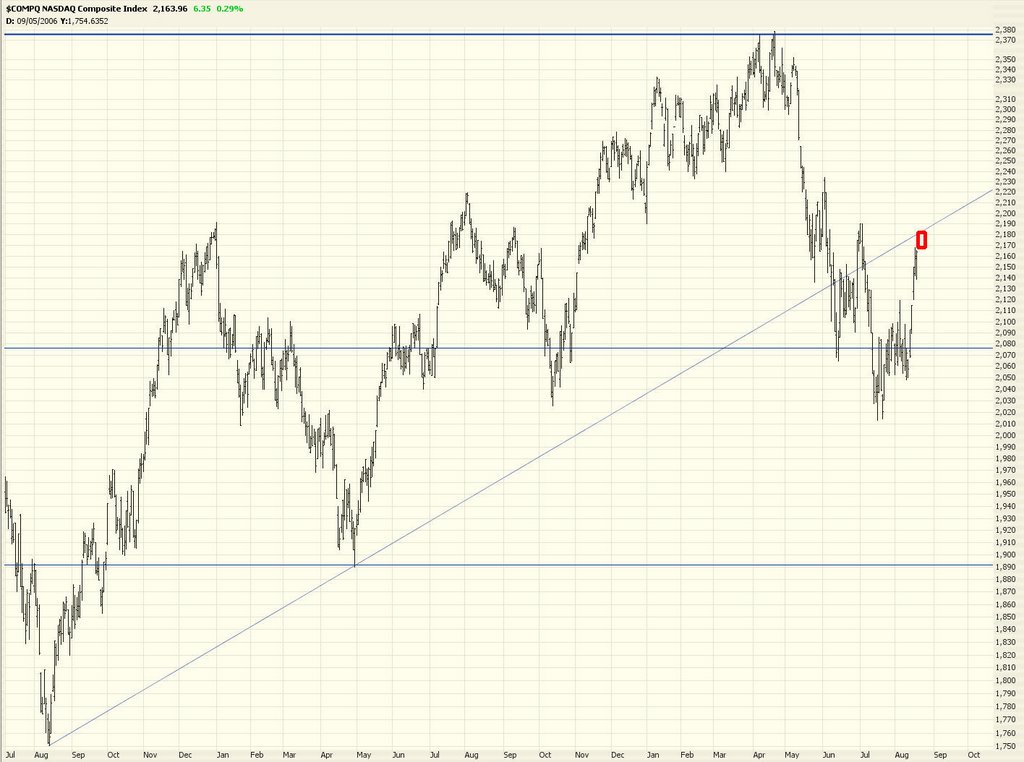
The NASDAQ Composite is basically out of room at this point. There's a tiny amount left between today's close and the resistance line.
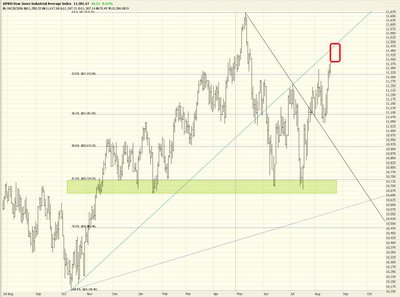
The Dow has been pushing toward its resistance line. It's not even that far away from its all-time high. As long as we're below resistance, I'm relatively OK with it.
The NASDAQ 100 is completely out of room. If it pushes higher on Monday, that's going to demand re-evaluation. |
|
|
 [复制链接]