搜索
楼主: hefeiddd

一个笨蛋的股指交易记录-------地狱级炒手

  [复制链接]
 楼主| 发表于 2009-5-12 07:45 | 显示全部楼层
11111111111

本帖子中包含更多资源

您需要 登录 才可以下载或查看,没有帐号?立即注册

x
金币:
奖励:
热心:
注册时间:
2006-7-3

回复 使用道具 举报

 楼主| 发表于 2009-5-12 07:46 | 显示全部楼层
I'm watching the Nasdaq 100 ($NDX) very closely, because a fall-away from the saucer pattern being built would be very bearish. Notice how the prior two saucer patterns were much, much bigger than the current one.......and they didn't even go up that much even when complete. What we want to see is (a) a failure for the saucer to form and (b) subsequent to that, a cross beneath the trendline shown here.


Lastly is the Dow Utilities ($UTIL, which has the ETF of UTH). The monster rally yesterday, fueled by relief over interest rate increases, pushed the price of this back to its neckline. It's getting soft again now, and I remain convinced the target shown in shaded green is going to be met.


at 4/19/2006 6 insightful comments
Links to this post
金币:
奖励:
热心:
注册时间:
2006-7-3

回复 使用道具 举报

 楼主| 发表于 2009-5-12 07:46 | 显示全部楼层
1111111111

本帖子中包含更多资源

您需要 登录 才可以下载或查看,没有帐号?立即注册

x
金币:
奖励:
热心:
注册时间:
2006-7-3

回复 使用道具 举报

 楼主| 发表于 2009-5-12 07:47 | 显示全部楼层
Tuesday, April 18, 2006Fibonacci Friendly Apple
First off, what in God's name is happening in the market today? It's acting hysterical! I admit I don't watch CNBC, but is there some wild rumor flying around? The market's been higher all day, but at one point it absolutely strapped on turbo blasters and soared higher, only to flip around and given back a lot of the recent gain (make no mistake, it's still up big-time today, but it's acting like a maniac).

Anyway, that's not what this post was about. I wanted to offer an example of what I call a Fibonacci friendly stock. In this case, Apple Computer (AAPL).

Not long ago, I pointed out that Apple was at a resistance point and that it would make a fairly safe short. This turned out well. One reader sent me a nice note saying he had made 40% on the puts for this based on the suggestion. Anyway, as you can see from the daily chart below, AAPL does tend to "cling" and "bounce off" its resistance lines. I've highlighted some areas in particular.


What's cool about these is that they make great exit points too. Take a look at this graph, which is the minute-by-minute chart of AAPL over the recent past:


I've marked five levels on the intraday chart where AAPL does this "bounce." For the recent short suggestion, the ideal time to close it out would have been the area marked as "5". As you can see, it touched the resistance line perfect before flipping around higher.

Fibs definitely don't work with all securities, but when you find one that is Fibonacci friendly, it tends to consistently behave that way.


at 4/18/2006 4 insightful comments
Links to this post


Newer Posts Older Posts Home
金币:
奖励:
热心:
注册时间:
2006-7-3

回复 使用道具 举报

 楼主| 发表于 2009-5-12 07:48 | 显示全部楼层
1111111111

本帖子中包含更多资源

您需要 登录 才可以下载或查看,没有帐号?立即注册

x
金币:
奖励:
热心:
注册时间:
2006-7-3

回复 使用道具 举报

 楼主| 发表于 2009-5-12 07:49 | 显示全部楼层
Monday, April 17, 2006Oil, Gold, Copper Stratospheric
I don't usually look much at commodities in this blog, but they've been going so insane lately it's worth a look. Remember that clicking any image makes a much larger image show up for greater detail.

Gold has been the talk of the town for a couple of years now. Here is a chart going back to the late 1970s, which includes the run up to about $875. Judging from the Fibonaccis, it seems that gold is well on its way to the $690 level.


But the real show is in copper, which is reaching levels never seen before. This kind of action would be the equivalent of Gold pushing past $2,000 per ounce. Fellow technician Michael Kahn makes a strong case for copper's rise to point to big-time inflation in our future.


Lastly, crude oil has also been pushing into never-before-seen levels. Will it cross into $80? Impossible to say. My recent bearishness on the oil services sector has not served me well, as crude's push higher and higher provides excellent support to bulls of these stocks.


Returning to the stock market......it seems we'll finally have a good reason for the market to snap out of its indecision....earnings! This week there will be hundreds of earnings reports, including IBM, Motorola, and Yahoo on Tuesday, Apple, JP Morgan, and Intel on Wednesday, and Google (plus an ungodly number of others...) on Thursday. This should provide for a lot of fireworks as the outlook on these companies clears.
金币:
奖励:
热心:
注册时间:
2006-7-3

回复 使用道具 举报

 楼主| 发表于 2009-5-12 07:50 | 显示全部楼层
111111111111

本帖子中包含更多资源

您需要 登录 才可以下载或查看,没有帐号?立即注册

x
金币:
奖励:
热心:
注册时间:
2006-7-3

回复 使用道具 举报

 楼主| 发表于 2009-5-12 07:51 | 显示全部楼层
The Dow 30 continues to be weak, clearing falling below and closing below the short-term trendline. The market is not clearly bearish until and unless it crosses below the medium-term trendline shown beneath it. The circled area indicates the close below the short-term trendline.


A few weeks ago, the stock market did make an attempt to push higher, but as you can see in the chart below, it was a flimsy attempt. This particular index is the American Major Markets ($XMI), and although it did cross above the resistance line here, the crossover was weak and short-lived. It has since slunked lower, yielding doubt on whether this pattern will ever truly become bullish.


One specific short suggestion from a reader of this blog is Kinder Morgan (KMI), which has a nice pattern, as shown below. Both the major ascending trendline has been broken and a good-looking topping pattern (which will be confirmed if it crosses the horizontal line shown) are in place.


at 4/17/2006 0 insightful comments
Links to this post
金币:
奖励:
热心:
注册时间:
2006-7-3

回复 使用道具 举报

 楼主| 发表于 2009-5-12 07:52 | 显示全部楼层
111111111

本帖子中包含更多资源

您需要 登录 才可以下载或查看,没有帐号?立即注册

x
金币:
奖励:
热心:
注册时间:
2006-7-3

回复 使用道具 举报

 楼主| 发表于 2009-5-12 07:53 | 显示全部楼层
Friday, April 14, 2006Good Charts for Good Friday
Happy three-day weekend, everyone. No sermons today. Just a few good charts.

First up is AutoDesk. I mentioned this one a few days ago and a "blast from the past." It looks like it's losing ground (which is good, since it's a short recommendation, as all of these are). If this really starts to fall, the key question is whether it will fall all the way down to the lowest trendline you see or not. I'll leave that judgment for later.


ESRX is a high-risk/high-reward trade. It's in a pretty decent topping pattern, and I'd suggest using that descending trendline (as opposed to a neckline) as my stop-loss point.


Perennial favorite GOOG looks like it's weakening after a stury push upward over the past six weeks or so. The Fibonaccis are helpful guides, but obviously not rock solid lines in the sand.


Holly (HOC), although a big winner over the past year for the bulls, is so lofty it represents a relatively low-risk short position, as dictated by the trendline you see. It seems to have peaked for now.
金币:
奖励:
热心:
注册时间:
2006-7-3

回复 使用道具 举报

 楼主| 发表于 2009-5-12 07:54 | 显示全部楼层
1111111111

本帖子中包含更多资源

您需要 登录 才可以下载或查看,没有帐号?立即注册

x
金币:
奖励:
热心:
注册时间:
2006-7-3

回复 使用道具 举报

 楼主| 发表于 2009-5-12 07:55 | 显示全部楼层
Holly (HOC), although a big winner over the past year for the bulls, is so lofty it represents a relatively low-risk short position, as dictated by the trendline you see. It seems to have peaked for now.


Finally, the utility ETF whose symbol is UTH is continuing to weaken, as I thought it would a couple of weeks back. The green highlight indicates my earlier prediction for how far it might fall.


at 4/14/2006 6 insightful comments
Links to this post


Newer Posts Older Posts Home
金币:
奖励:
热心:
注册时间:
2006-7-3

回复 使用道具 举报

 楼主| 发表于 2009-5-12 08:17 | 显示全部楼层
1111111111

本帖子中包含更多资源

您需要 登录 才可以下载或查看,没有帐号?立即注册

x
金币:
奖励:
热心:
注册时间:
2006-7-3

回复 使用道具 举报

 楼主| 发表于 2009-5-12 08:18 | 显示全部楼层
Tuesday, April 11, 2006Medium Term Trendline Broken!
OK, good. In spite of an earlier bounce off the supporting trendline, the Dow lost its footing and broke beneath it. The first step in the two-step process I outlined yesterday has taken place.


It's clear the market is losing steam. We're also exiting the strong November-April season and heading into the weaker May-October season. As earnings season approaches, the opportunity for the long-awaited downdraft may be upon us. The next psychological barrier is to break below 11,000. Next, it needs to break below the 10,922 low set on March 8th. That would bring an end to the series of higher highs and higher lows that has been in place since October 13 of last year.


at 4/11/2006 5 insightful comments
Links to this post


Dow Trend Bounce
Just a quick intraday post - take a look at the first graph in yesterday's post, showing the two ascending trendlines the Dow has to break in order to turn bearish. The market's down right now, but look at how the Dow hit the higher trendline and immediately bounced.


As long as I've been doing this, I continue to be amazed. Anyway, you can see the market respects this line in the sand. It's got to break the line clearly to make the next move down.


at 4/11/2006 1 insightful comments
Links to this post
金币:
奖励:
热心:
注册时间:
2006-7-3

回复 使用道具 举报

 楼主| 发表于 2009-5-12 08:19 | 显示全部楼层
1111111111111

本帖子中包含更多资源

您需要 登录 才可以下载或查看,没有帐号?立即注册

x
金币:
奖励:
热心:
注册时间:
2006-7-3

回复 使用道具 举报

 楼主| 发表于 2009-5-12 08:19 | 显示全部楼层
Monday, April 10, 2006The Return of Johnny One-Note
Last week, I tried to buy the bullish argument. I really tried. I even made a few suggestions on stocks. But I just don't buy it. This market, it seems to me, is too weak to do what the bulls want it to do.

The post-bear market recovery that started in October 2002 and continues to this day have pushed some stocks hundreds - even thousands - of percent higher. But as I look at all the major averages and hundreds of different major stock charts, I cannot escape one simple conclusion: even if I wanted to buy, there's just really not much good "merchandise" out there. It's far easier to find stocks prone to fall than it is to find stocks prone to rise more.

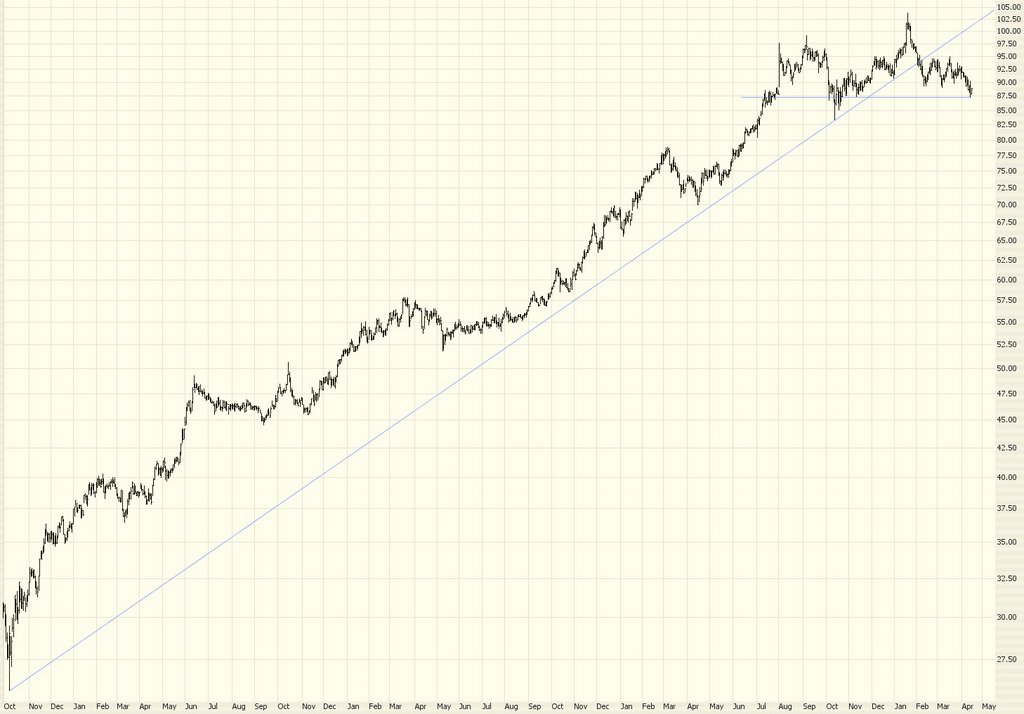
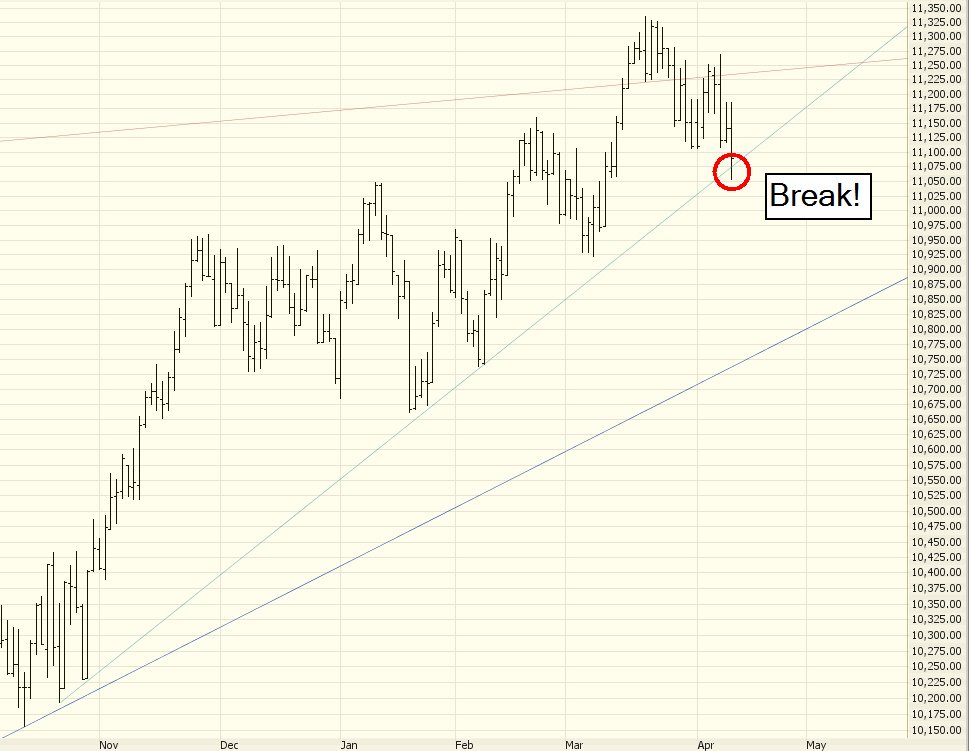
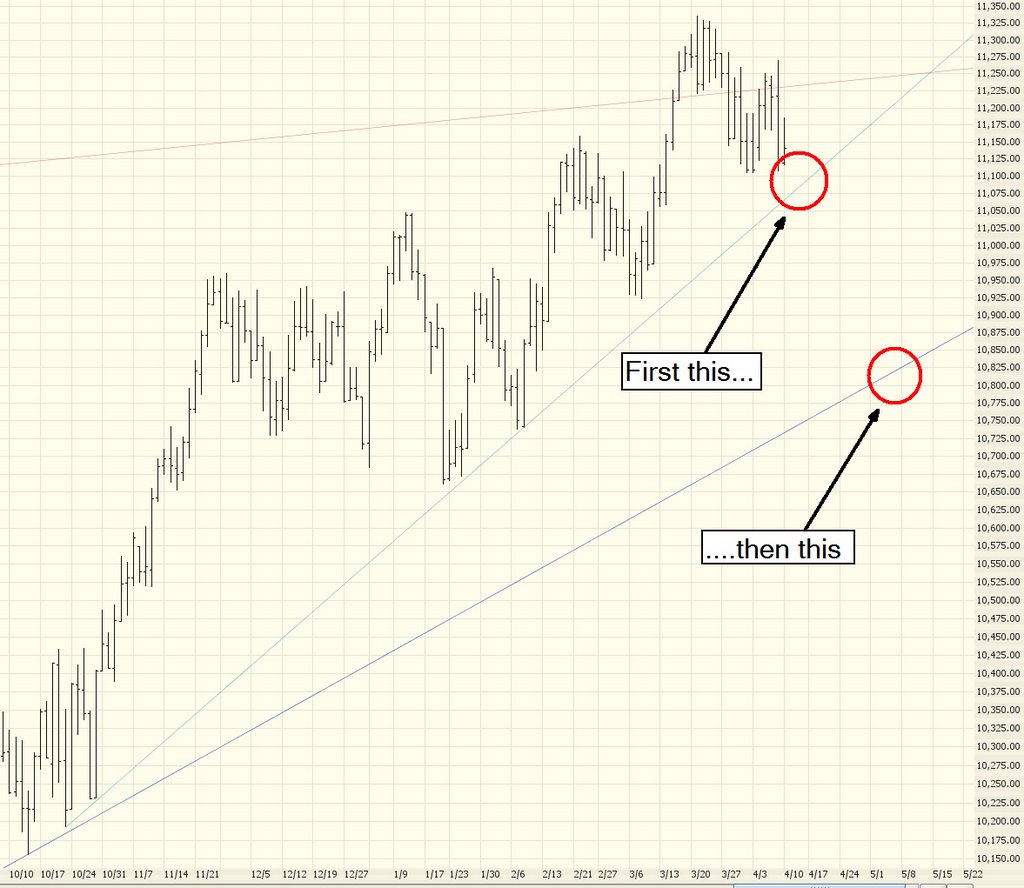
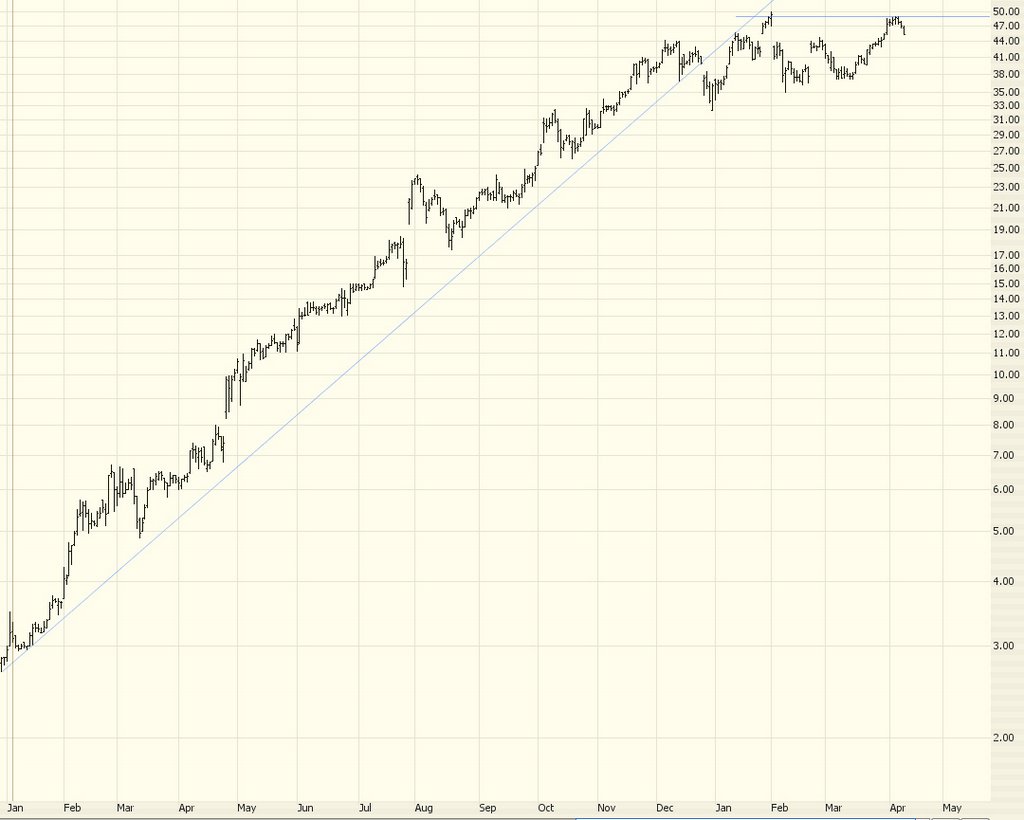
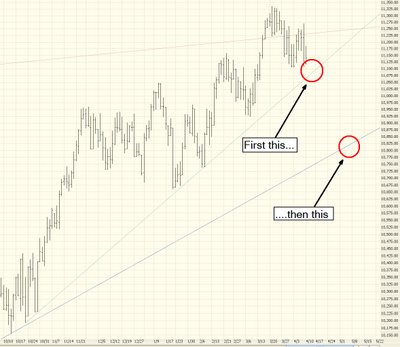
Let's take a look at the latest charts of three major U.S. averages. First, the Dow Jones 30. In order to get truly bearish, it needs to break its short-term ascending trendline as well as its medium-term ascending trendline. This index has been inching up for the past six months, and it has the potential to keep doing so unless both of these trendlines are clearly broken.


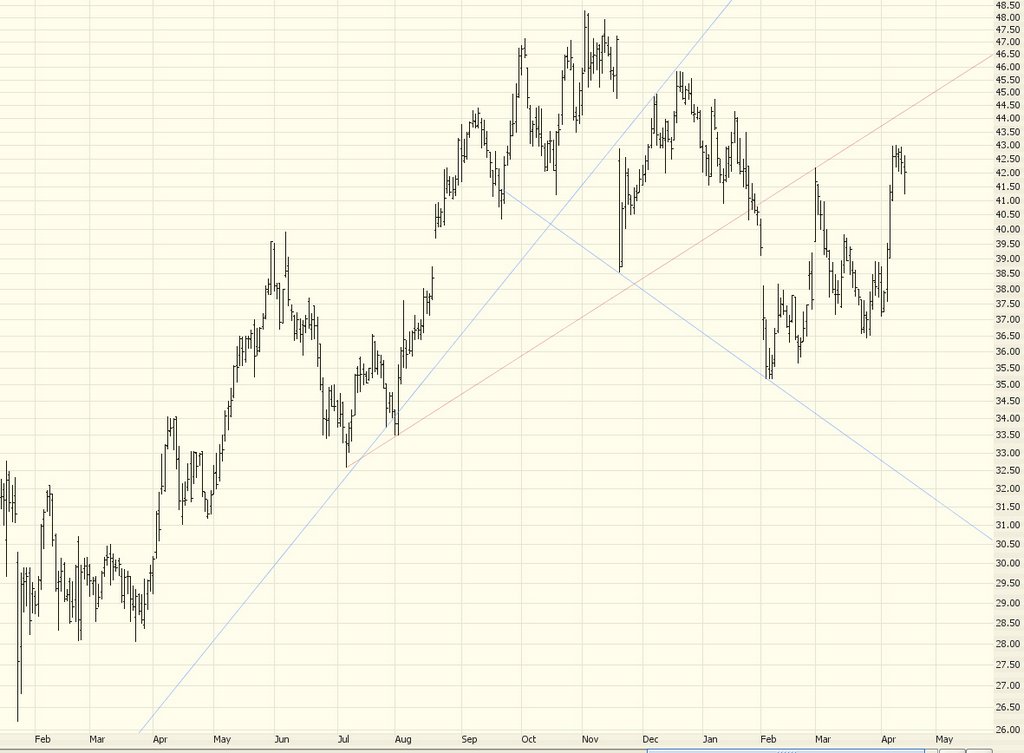
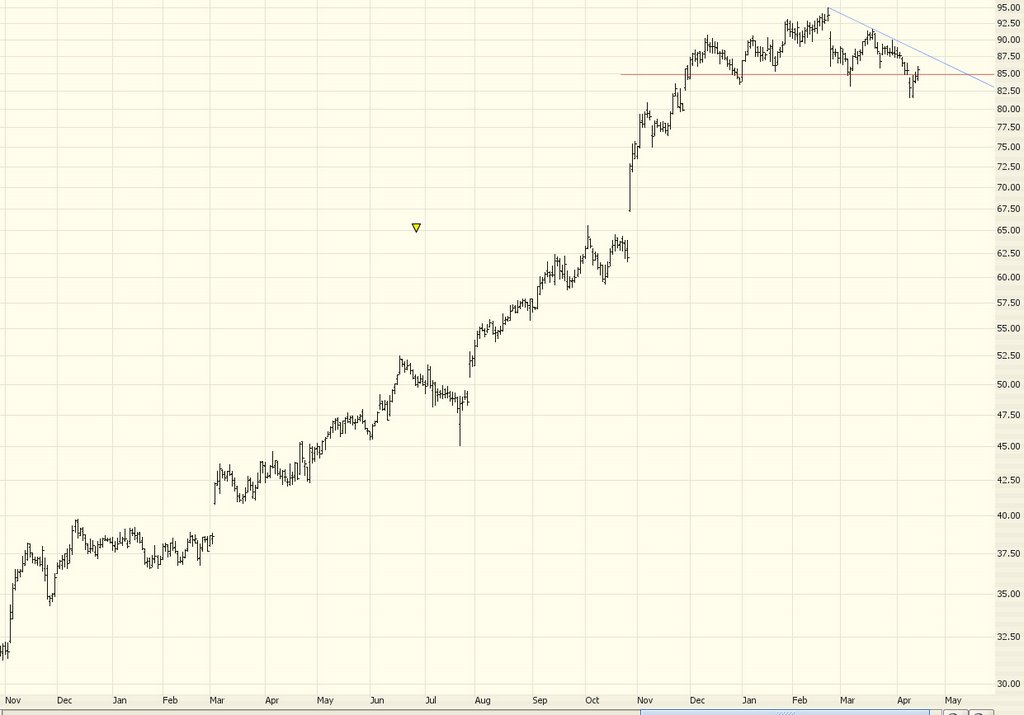
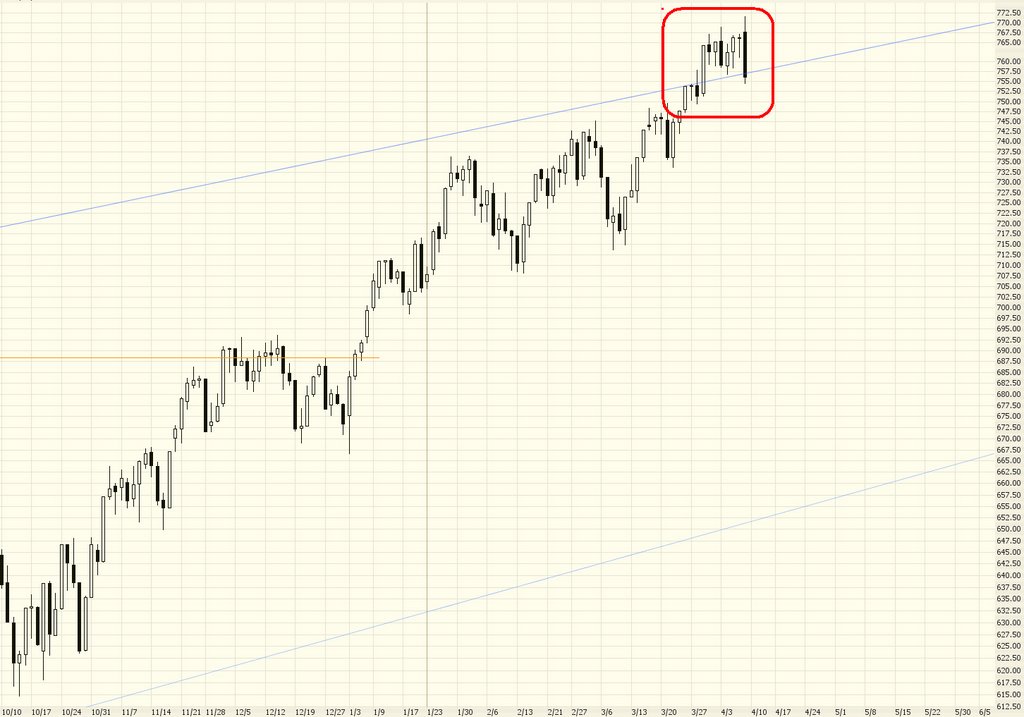
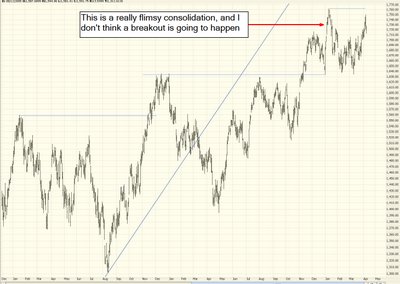
Next is the NASDAQ 100, which has been weaker than the Dow over the same time period. This index has, over a three month period, formed a modest saucer pattern, but it's relatively wimpy and the prices simply aren't pushing strongly higher. If this pattern collapses, I think it might mark the turning point.


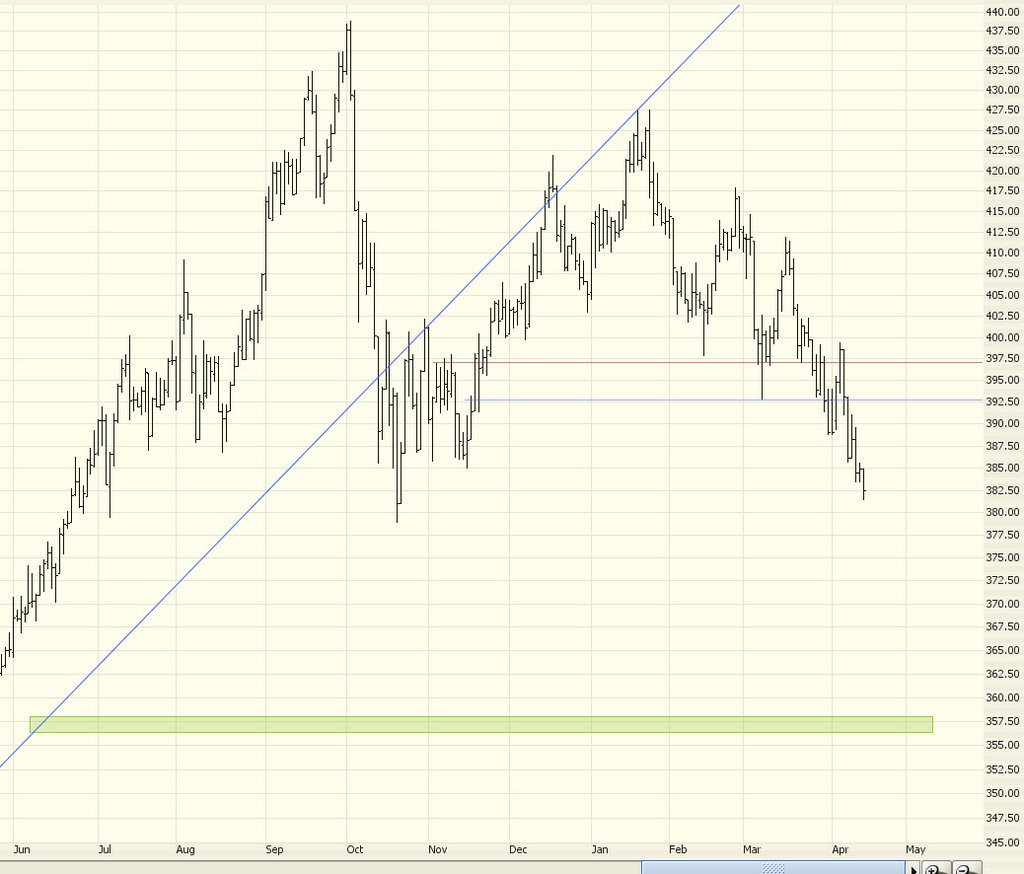
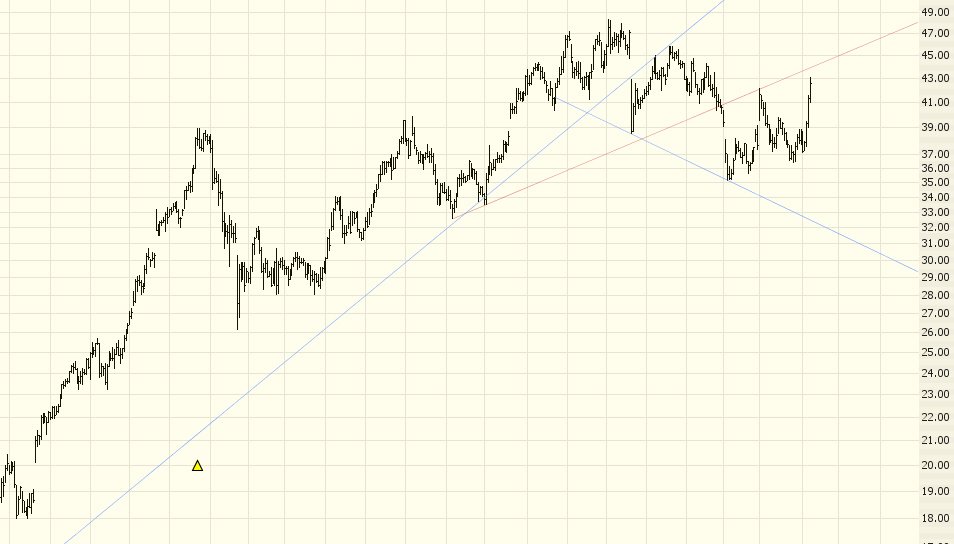
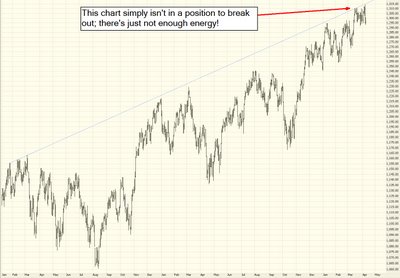
Lastly is the all-important S&P 500. The ascending trendline, representing resistance, is easy to see here, and recently it was pushing up against this trendline. Prior attempts to push past it have failed, and after last Friday's swoon, I think the hope for any big breakout is fading. Anything short of stellar Q1 earnings in the market could mean the end of what has to date been a fairly steady advance by the market over the past three and a half years.


at 4/10/2006 3 insightful comments
Links to this post


Newer Posts Older Posts Home
金币:
奖励:
热心:
注册时间:
2006-7-3

回复 使用道具 举报

 楼主| 发表于 2009-5-12 08:20 | 显示全部楼层
11111111111

本帖子中包含更多资源

您需要 登录 才可以下载或查看,没有帐号?立即注册

x
金币:
奖励:
热心:
注册时间:
2006-7-3

回复 使用道具 举报

 楼主| 发表于 2009-5-12 11:10 | 显示全部楼层
Monday, April 10, 2006Express Scripts and a Look Back
I suggested shorting Avalon Bay and Health Net. I'm pleased to see both of these stocks have fallen pretty much every day since then.

Another stock I've been watching a while is Express Scripts (ESRX) which broke its neckline today and seems like a pretty clean short sale.


Another high-flier which looks like it has double-topped is old favorite NutriSystem (NTRI).


My recent "bullish picks" absolutely stink. I think I'll stick with being a bear! There are just so many great shorts out there right now. If I get time, I'll review a few this afternoon.


at 4/10/2006 3 insightful comments
Links to this post
金币:
奖励:
热心:
注册时间:
2006-7-3

回复 使用道具 举报

 楼主| 发表于 2009-5-12 11:11 | 显示全部楼层
11111111

本帖子中包含更多资源

您需要 登录 才可以下载或查看,没有帐号?立即注册

x
金币:
奖励:
热心:
注册时间:
2006-7-3

回复 使用道具 举报

 楼主| 发表于 2009-5-12 11:13 | 显示全部楼层
Friday, April 07, 2006Rates Weigh Down the Market
Well, forget about this being bullish - even temporarily. The market is losing momentum, and all these hyperbolic charts are looking sick.

The interest rates are starting to weigh on the market. A number of weeks ago I pointed out that the Utilities were going to get smashed, and they have been. The head & shoulders pattern is crystal clear now.

The reversal today was extraordinary. Below is the Russell 2000. The open was a new lifetime high on this index, and the close was substantially below it. The portion rectangled in red is the "churning" that's been taking place above the former resistance trendline. It will need to smash below this decisively to clearly be bearish.


We've had good luck with Autodesk a couple of times before, so let's try for a third. This is pushing up towards a medium-sized resistance line. I'd say short this and stop at any price above $44.


We've also been watching Genentech for a while, and it's finally broken its neckline. This is a pretty massive pattern, so it's fairly promising, especially considering the poor performance of biotechs over the past few months when the market as a whole has been pretty strong. I'd suggest shorting this one, stopping out at any price above $89.91.


Have a good weekend, everyone!


at 4/07/2006 2 insightful comments
Links to this post
金币:
奖励:
热心:
注册时间:
2006-7-3

回复 使用道具 举报

您需要登录后才可以回帖 登录 | 立即注册

本版积分规则

本站声明:MACD仅提供交流平台,请交流人员遵守法律法规。
值班电话:18209240771   微信:35550268

举报|意见反馈|手机版|MACD俱乐部

GMT+8, 2025-8-5 04:25 , Processed in 0.040229 second(s), 9 queries , MemCached On.

Powered by Discuz! X3.4

© 2001-2017 Comsenz Inc.

快速回复 返回顶部 返回列表