- 金币:
-
- 奖励:
-
- 热心:
-
- 注册时间:
- 2006-7-3
|
|

楼主 |
发表于 2009-3-28 15:54
|
显示全部楼层
How to Set Stops
As you know from my Three Rules page, setting stops is really important to me. But people ask me all the time "where do I set my stop?"
The unsatisfying but truthful answer is: it depends on the chart. Simply stated, you should set a stop at the price point which, if reached, indicates that your conclusion about a chart's projected price movement was wrong. Putting it a different price, if, at a certain price, your chart pattern is invalidated, it's time to get out at once.
I tend to trade bearishly, so these will be short positions, but you can just mentally flip the chart upside down to get the same idea. But here are a few examples:
The chart below shows an instance - which is quite common - where you need to decide how conservative your stop is going to be. The red circled price indicates the more conservative stop, since at the first sign of trouble (specifically, the series of lower highs being broken) you get out of the position. A looser stop - and thus one which exposes you to larger losses - is circled in green. That shows the lifetime high on the stock, plus a double stop. A price above this level would obviously be very bad for a bear in this position (keep in mind, a bearish position is assumed for all these examples).

The next chart is similar in the respect that the red circle shows the tighter, more conservative stop, whereas the green shows the looser stop. In this case, I would be strongly inclined to set the stop price in red, since the basis for the trade is very plainly the series of lower lows.

Sometimes the stop price is quite obvious, such as with a horizontal line. If resistance is broken (for bearish positions) or support is broken (for bullish positions), it's time to get out. In the example below, simply by mousing over the horizontal line, ProphetCharts shows the precise dollar amount which, if exceeded, indicates it's time to exit the short position.

If you take a bearish position on a stock which is otherwise quite a bullish pattern (like in the chart below, which frankly has no bearish configuration to it), setting the stop at the high price is the only way to go. It's quite likely that a new high price will be made, and if it is, you don't want to sit around to see just how high this price gets.

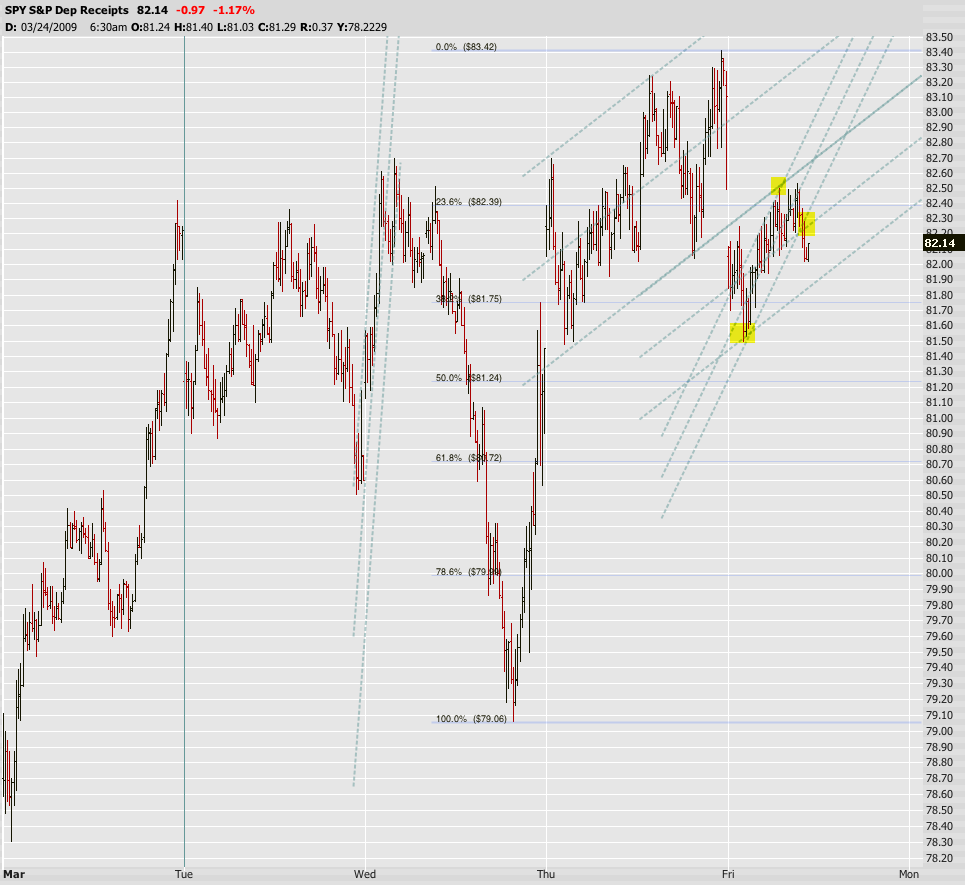
Trades based on Fibonacci patterns are, similar to horizontal lines, easy for stop-setting. In this case, you want to set the stop at the price just above the next Fibonacci level above (or, for bullish positions, the next one below). So in this example, the next line up is at $157.60, so any price above this level indicates an exit signal.

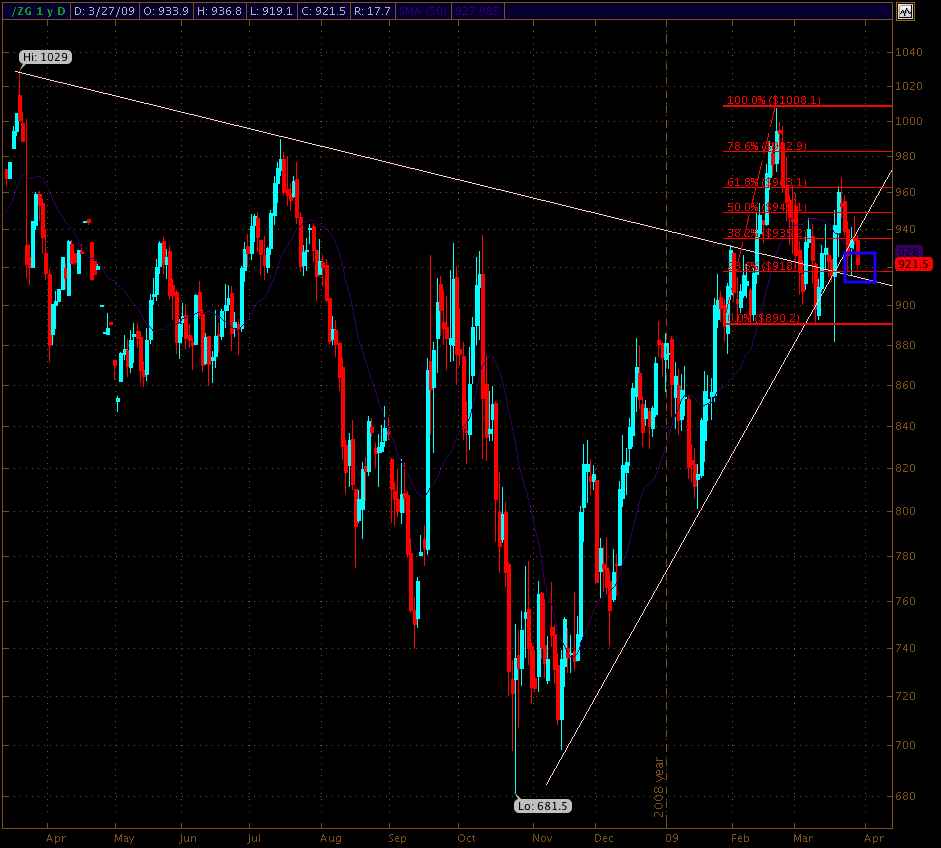
One final example is with a broken trendline. Here, the red circle shows a price level that would be discouraging for a bearish position, since it would indicate enough strength on the stock's part to muscle its way to the other side of that trendline. Simply stated, if the basis for the trade (in this instance, a broken trendline) is negated, then the likelihood of a profitable trade is diminished too.
s
So the seeming cop-out of "it depends on the chart" is, as you can see, quite true. But I hope this gives you the general idea. |
|
|
 [复制链接]