- 金币:
-
- 奖励:
-
- 热心:
-
- 注册时间:
- 2006-7-3
|
|

楼主 |
发表于 2009-3-24 13:48
|
显示全部楼层
8 2 06
I’ve noticed in the past that when I have a large losing day, it tends to flush out any excitement about making money. Then I am battle scarred. This am I was just going to sleep in. But I realized wanting to sleep in, and having a large loss day probably meant I would trade with caution and maybe do ok, which is what happened. <!--[if !supportEmptyParas]--> <!--[endif]-->
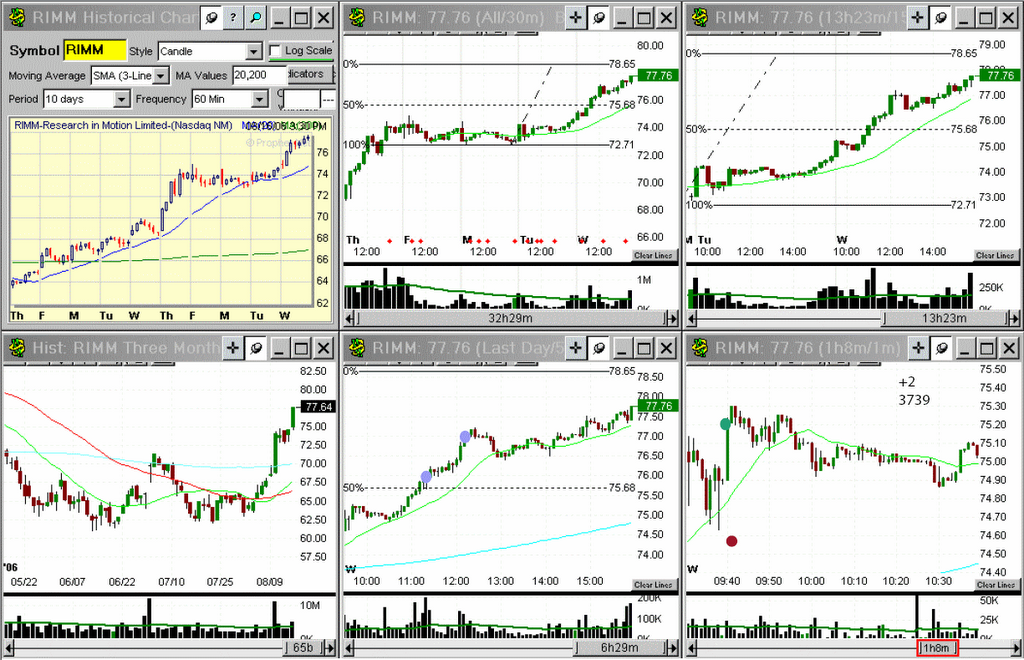
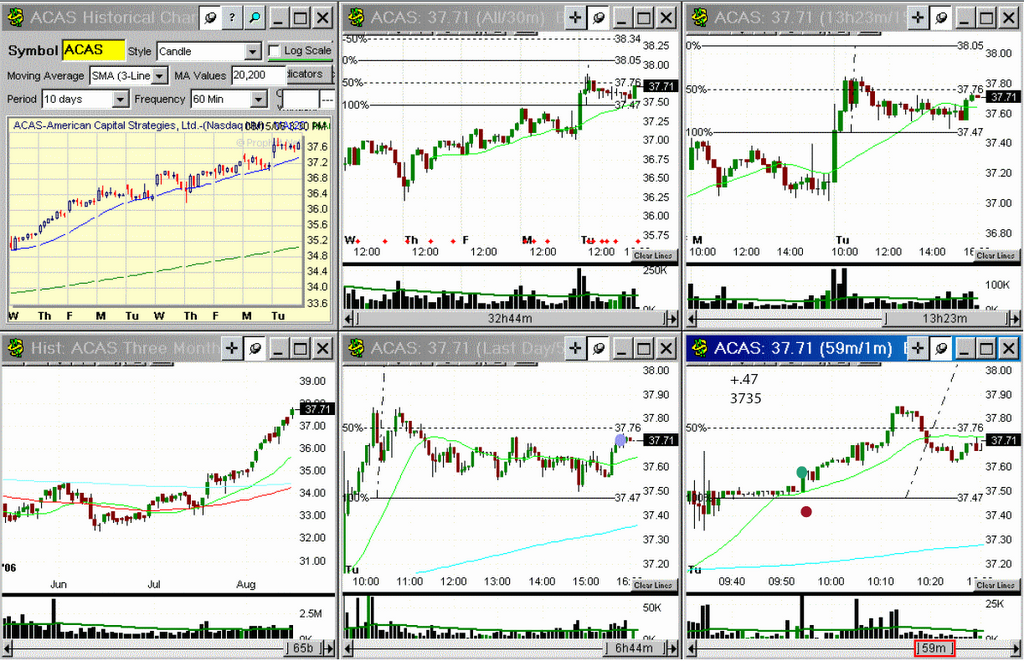
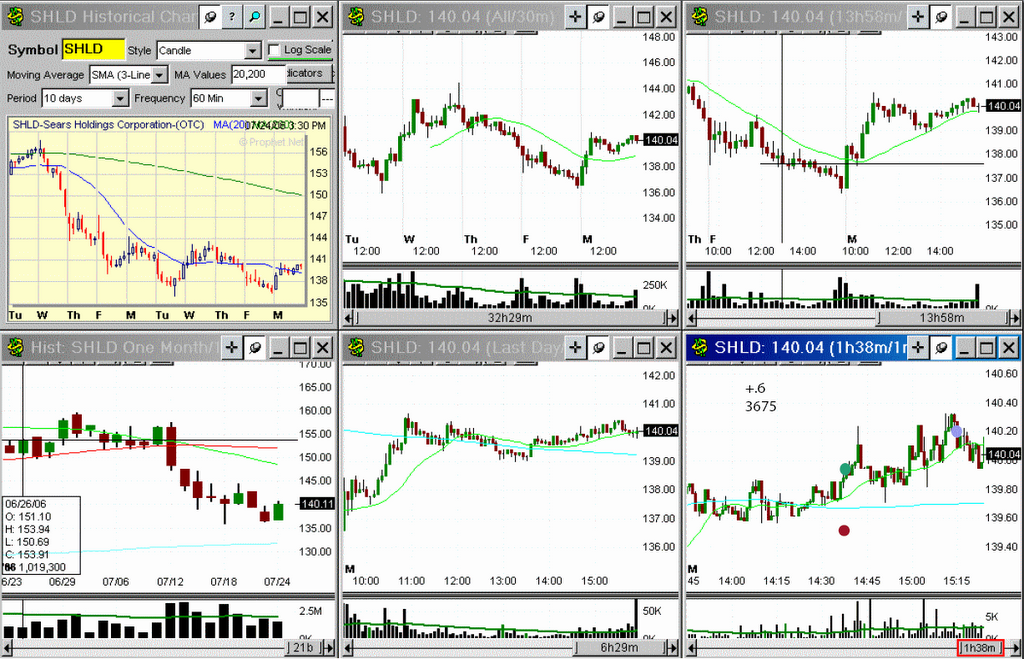
MDRX:
<!--[if !supportEmptyParas]-->  <!--[endif]--> <!--[endif]-->
Here is another example of the serious issue I have with getting more gain out of the occasional large winner. This had the potential of 7 to 1 risk reward, and with just a simple trailing 5min 20sma it would’ve been 6 to 1. But, those same exits on a lot of trades I take would be unacceptable. Anyway, I am going to, with a friend, try to come up with as many exit ideas as possible. MDRX was an ok gap, though the gap was out of a few days in a row upside move, which is risky for being more of an exhaustion gap rather then the start of a new trend move on the daily chart. It did have a nice 1 min base, and I hesitated to get in closer to 20.05 or so. You can see the volume was light in that 1 min base. This trade I was certain would go to at least 20.50, even though it wasn’t a perfect pattern. You can see that the gap equal move that I saw right at the open, 20.84 was small resistance at 10a.
<!--[if !supportEmptyParas]--> <!--[endif]-->
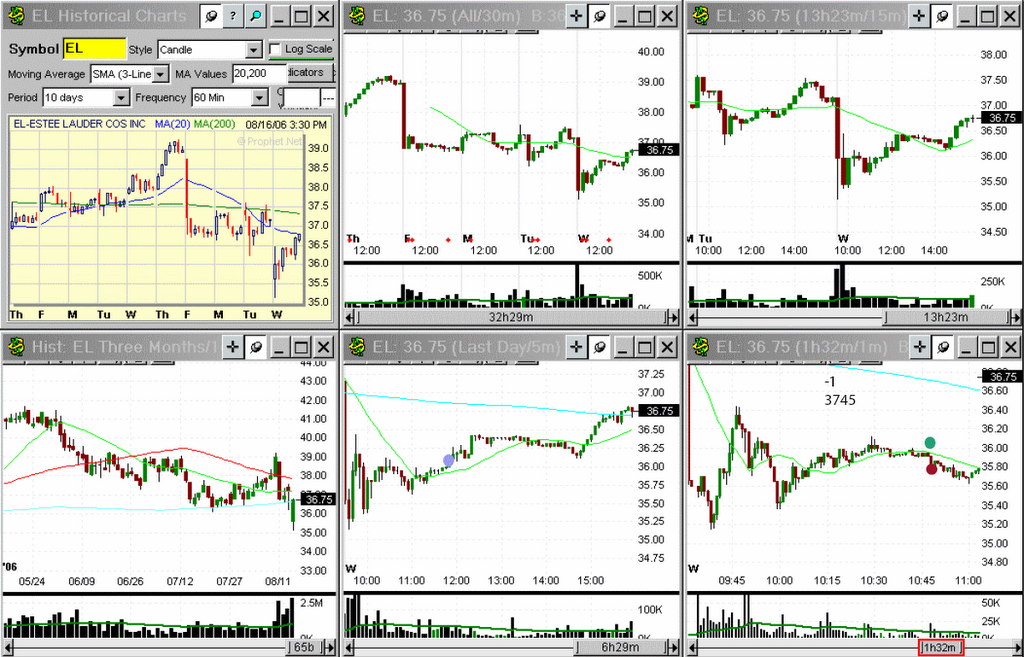
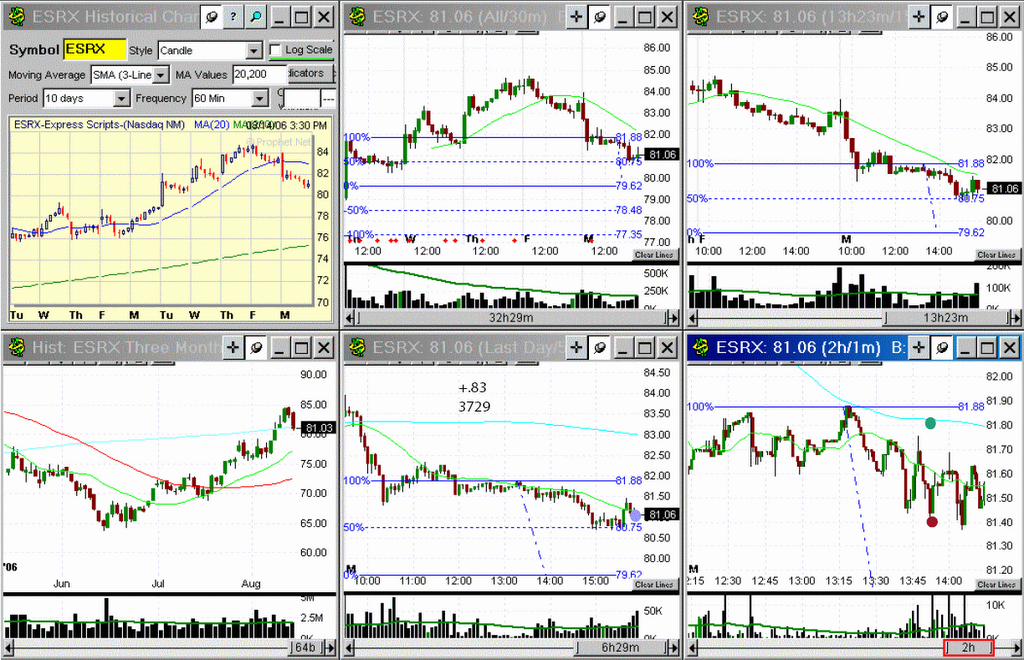
FFIV:
<!--[if !supportEmptyParas]-->  <!--[endif]--> <!--[endif]-->
I thought the 1min pattern was perhaps going to trigger a larger 30min breakdown. I was wrong in this case, but this kind of concept to the short side has been really great recently so I think it was worth a try. The first 1min equal move target of 44.24 held well and when I saw that I decided to take half off in case it reversed more strongly. At this point it seemed to me a difficult day for trading, there was a lot of choppiness. The only thing better to have done with my second exit was to wait until that base worked out then have stop above it, in case this reversed down from 44.50 resistance. One overall big con for FFIV was how there was the lower low into new lows of the day. If I got into FFIV at a similar looking base around 44.80, this would’ve been the kind of trade that performs best.
<!--[if !supportEmptyParas]--> <!--[endif]-->
It seems that perhaps I take a full loss on FFIV if I am trying to have things like MDRX work out much farther. What I would rather be able to do is have an objective way of judging trades as they unfold, so I don’t have to trade weak performing trades like FFIV like I do MDRX.
<!--[if !supportEmptyParas]--> <!--[endif]-->
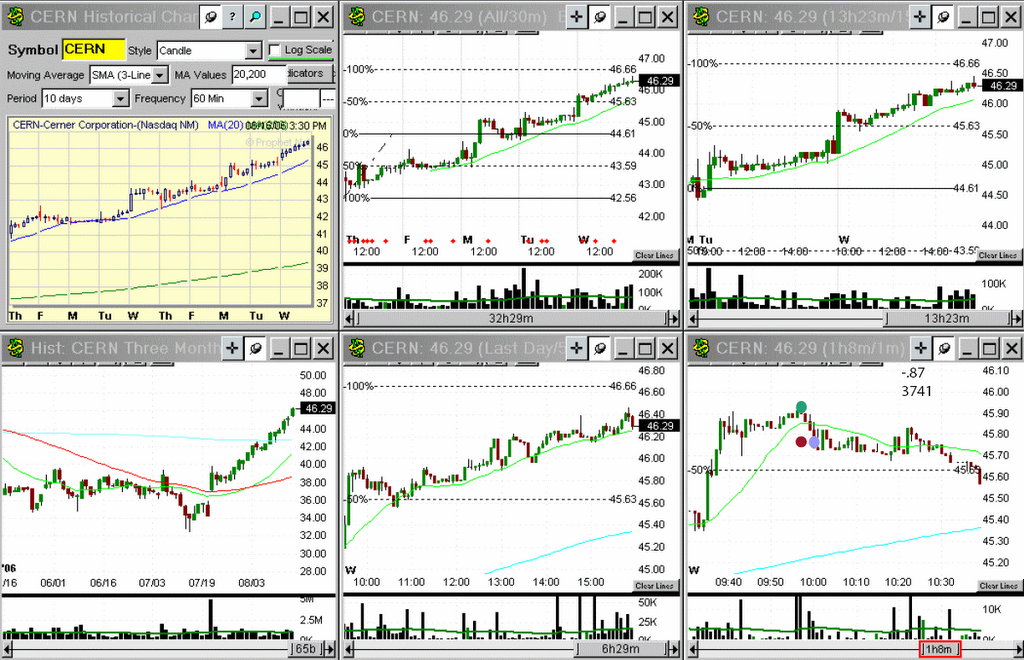
CTSH:
<!--[if !supportEmptyParas]-->  <!--[endif]--> <!--[endif]-->
I took half risk on this because I am having recent difficulties trading, or, I am in a drawdown period. Also, CTSH the pace on the 1min was not perfect, I did like the 5min base with light volume at highs, but on the 1min it was choppy and some strong pace to the downside. I did think this had a good chance to get to 68.50, but because of the cons of the pace, when it stalled where it did I got right out. You can see there was a rinse bounce through to 68 support area, probably triggering stops, then it bounced right back to 68.30 area again.
<!--[if !supportEmptyParas]--> <!--[endif]-->
If you compare MDRX and FFIV, in both of these they moved slightly in my favor, then tested the entry area, then went higher. A difference though was that the pullback on MDRX right after I got in was slow and it didn’t even test 22. On CTSH the pace was rather equal move compared to the move into 68.20, and it rinsed 68 rather than finding support.
<!--[if !supportEmptyParas]--> <!--[endif]-->
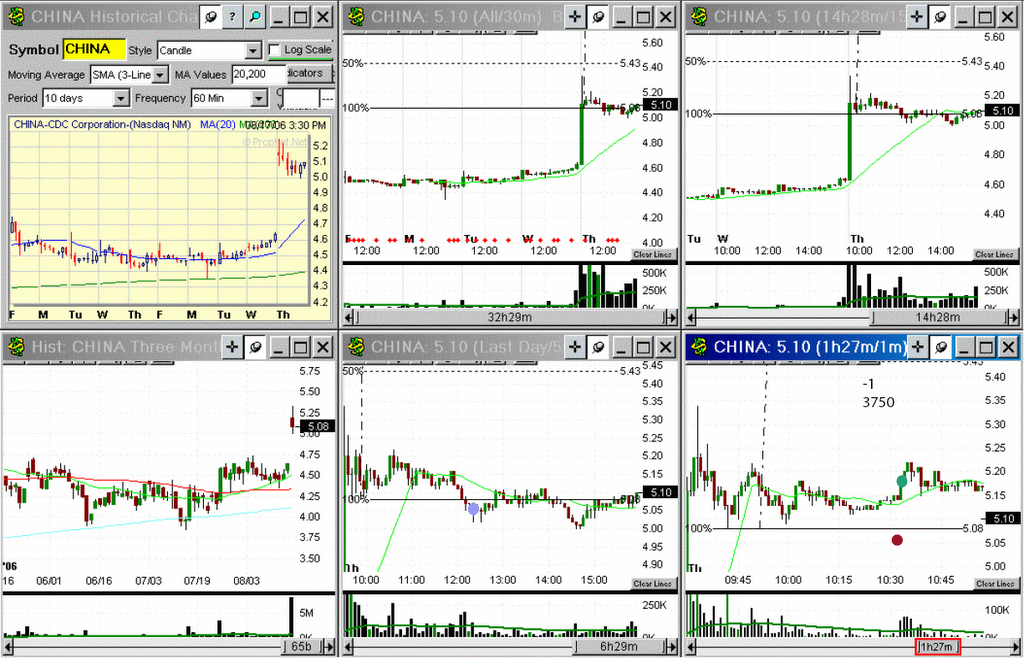
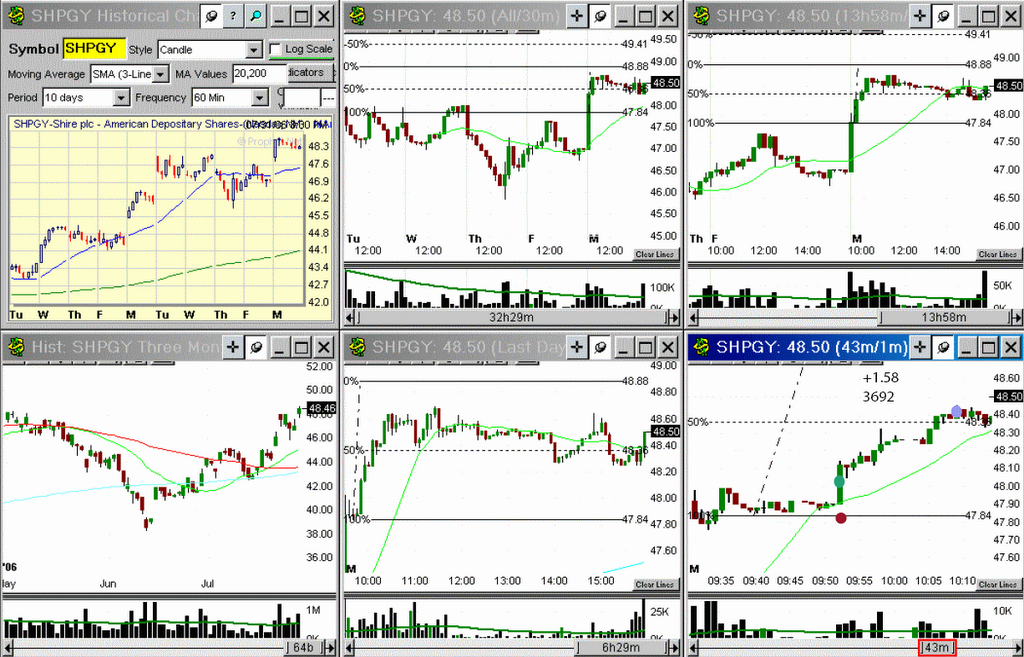
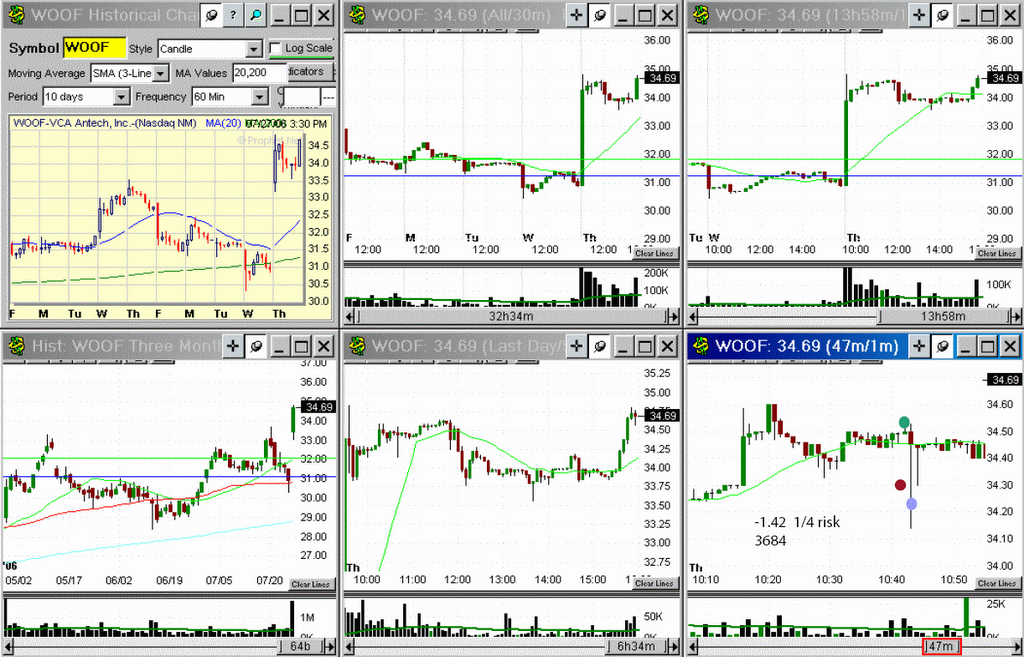
CKFR:
<!--[if !supportEmptyParas]-->  <!--[endif]--> <!--[endif]-->
I thought that CKFR would follow through back to the downside, and that I was getting into an avalanche on a bearish stock thing I have been seeing. It’s a good thing I did half risk. You can see it hit the tiny equal move zone at 36.08 but I was too greedy. This wasn’t a great setup; it had already pulled up far around 11.30a. The pace had turned over to face the downside but I should’ve been happy just watching this instead of trading it.
<!--[if !supportEmptyParas]--> <!--[endif]-->
By the way, all the fibonacci lines I have drawn in I either draw in before I take the trade or immediately after. There is no back optimization on those, i.e. I don’t draw them in at the end of the day where they work best.
<!--[if !supportEmptyParas]--> <!--[endif]-->
<!--[if !supportEmptyParas]--> <!--[endif]-->
Here are some exit stats on these trades, can see how massive MDRX was and how my alternate plans would’ve captured decent gains:

Posted by Chrisnyork at 8/02/2006 04:53:00 PM
0 comments Links to this post 
8/01/20068 1 06
Today I traded badly. This is like a bunch of other days. I wasn’t willing to walk away with a medium sized loss, instead tried to make it back and ended up with double that loss I should’ve accepted. I also haven’t been wanting to trade all of a sudden after having 15 days with only 2 losing days. I think in the future I will respect that and take a day off. So I am going to do this laborious exercise I developed when ALL I did was lousy trades like today.
SPLS:

TREND DEVELOPMENT:
Areas I didn’t follow my plan and had bad results:
Worst was bailing right at perfect short. Broke my plan and got rinsed. I could’ve waited all day while it made decent tries for 21.
Areas I followed my plan and had bad results:
Areas I didn’t follow my plan and had good results:
WFMI:

TREND DEVELOPMENT:
Uptrend, downtrend or sideways trend?
3 waves, two waves with base then continuation or nothing?
Pros:
This had a very nice daily, basically perfect though it was a few times larger then average daily range, and if it is only 1 or 2 times the average daily range, the gap is a bit safer.
Cons:
SUPPORT RESISTANCE
Price support and resistance (whole number, chart levels, equal move)?
Indicator support and resistance?
Pros:
I thought 50.50 then 50 would be good targets, but only 50.50 then it ran through my original stop.
Cons:
VOLUME
Greater on move and diminished on correction?
Euphoria and capitulation events?
Pros:
This was decent lighter volume pullback.
Cons:
PACE
Slower than average moves will often lead to continuations of the prior trend.
Stronger than average moves will tend to correct with slower ones.
Comparable moves near average will tend to lead to trading ranges.
Continuation bases tend to be 1 to 2x length of previous move.
Pros:
Cons:
I would have to say under pace, that because this had just made new lows it wasn’t the best of these kinds of trades. The best of these it will make a spike then fade back up just like this did before I entered, but, that spike down and move up WOULD NOT HAVE JUST TRIGGERED NEW LOWS of the day. This means less likely a lot of people are aware of this, that I am getting in before those new lows of the day trigger all kinds of alerts.
CORRRECTION PERIODS
Identify important correlations:
Pros:
This seemed to be drop off 1min 20sma pivot right at 9.45a.
Cons:
PUTTING IT ALL TOGETHER
Gain or Loss:
-.69
Pros:
Trend
SR
Volume
Correction Period
Cons:
Pace
Things I did correctly:
My stop was ok, the daily was decent.
Things I could have done better:
Held original stop, taken partial at 50.50 area then get stopped with stop above base at 10.15a.
Areas I followed my plan and had good results:
This did go to 50.50 and this sort of daily chart is usually very good.
Areas I didn’t follow my plan and had bad results:
I bailed at the worst point.
Areas I followed my plan and had bad results:
Areas I didn’t follow my plan and had good results:
CCRT:

TREND DEVELOPMENT:
Uptrend, downtrend or sideways trend?
3 waves, two waves with base then continuation or nothing?
Pros:
Cons:
Here again can see the lower low created from the move down yesterday. So even though it seems to be an ok base, this was actually day 2 of daily move down.
SUPPORT RESISTANCE
Price support and resistance (whole number, chart levels, equal move)?
Indicator support and resistance?
Pros:
Cons:
I sold right at 32 support, either I should’ve gotten in earlier or later.
VOLUME
Greater on move and diminished on correction?
Euphoria and capitulation events?
Pros:
Lighter volume pullback.
Cons:
PACE
Slower than average moves will often lead to continuations of the prior trend.
Stronger than average moves will tend to correct with slower ones.
Comparable moves near average will tend to lead to trading ranges.
Continuation bases tend to be 1 to 2x length of previous move.
Pros:
Cons:
This really was choppy and kind of dangerous.
CORRRECTION PERIODS
Identify important correlations:
Pros:
Not sure.
Cons:
PUTTING IT ALL TOGETHER
Gain or Loss:
-.65
Pros:
Volume
Cons:
Trend
SR
Pace
Correction Period
Things I did correctly:
Nothing, shouldn’t have taken it but guess what, I bailed and then it went to my target to the cent.
Things I could have done better:
Areas I followed my plan and had good results:
Areas I didn’t follow my plan and had bad results:
My original stop was never hit. This went to my targets. Would’ve been 2 to RR if I followed my original plan.
Areas I followed my plan and had bad results:
Areas I didn’t follow my plan and had good results:
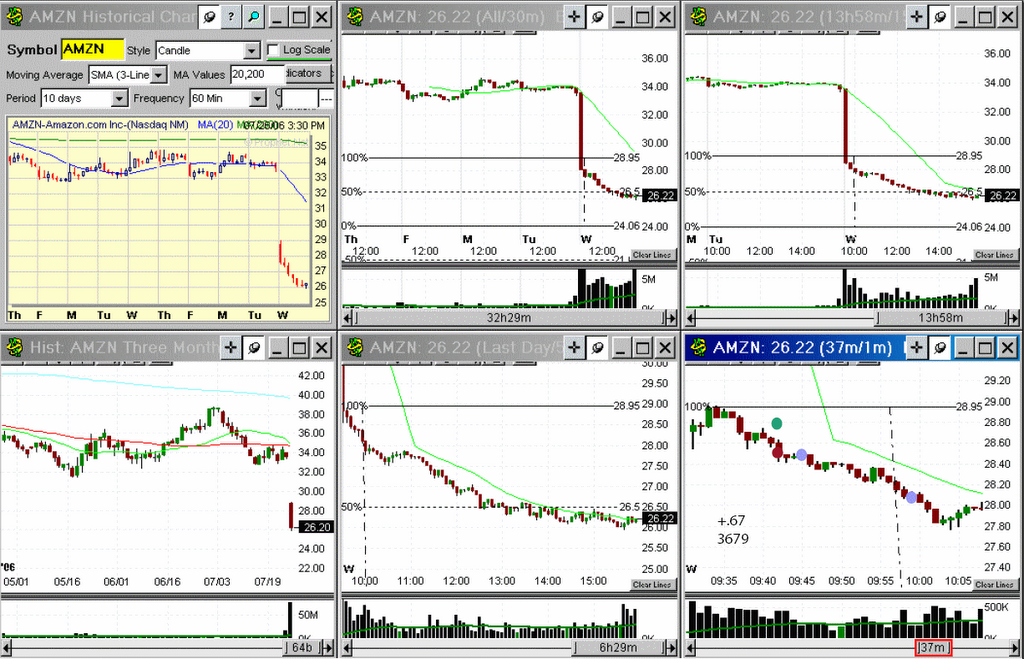
AFFX:
TREND DEVELOPMENT:
Uptrend, downtrend or sideways trend?
3 waves, two waves with base then continuation or nothing?
Pros:
This was a decent gap down, other than being over 2 times daily range.
Cons:
SUPPORT RESISTANCE
Price support and resistance (whole number, chart levels, equal move)?
Indicator support and resistance?
Pros:
Cons:
Sold right at 18 support.
VOLUME
Greater on move and diminished on correction?
Euphoria and capitulation events?
Pros:
Light volume base but in this case maybe indicated a con since it was also at 18 support.
Cons:
PACE
Slower than average moves will often lead to continuations of the prior trend.
Stronger than average moves will tend to correct with slower ones.
Comparable moves near average will tend to lead to trading ranges.
Continuation bases tend to be 1 to 2x length of previous move.
Pros:
Cons:
This was rounding lows. Downside pace was slowing down a bit. This was descending pennant.
CORRRECTION PERIODS
Identify important correlations:
Pros:
Cons:
This and the previous trade I entered right when number came out at 10a.
PUTTING IT ALL TOGETHER
Gain or Loss:
-.93
Pros:
Trend
Volume
Cons:
SR
Pace
Correction Period
Things I did correctly:
Nothing.
Things I could have done better:
Used rinse bounce and waited for move back to entry area.
Areas I followed my plan and had good results:
Areas I didn’t follow my plan and had bad results:
This wasn’t a correct setup.
Areas I followed my plan and had bad results:
My stop was what I think of as a sucker stop. Sort of obvious and after it is hit you have nothing but better prices available.
Areas I didn’t follow my plan and had good results:
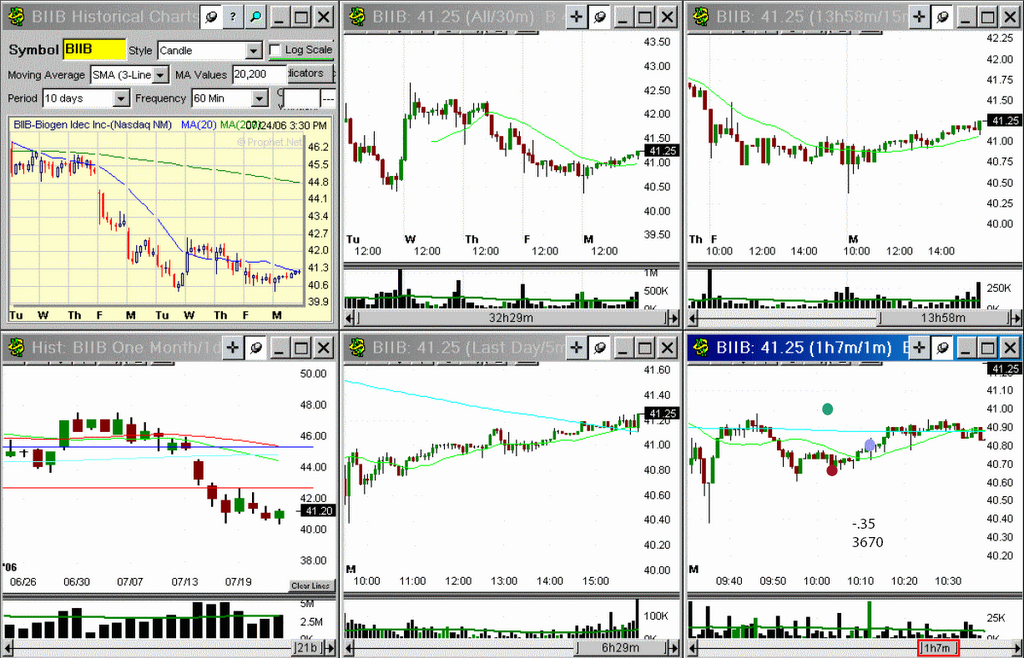
CKFR:

TREND DEVELOPMENT:
Uptrend, downtrend or sideways trend?
3 waves, two waves with base then continuation or nothing?
Pros:
This 30min chart was actually very correct. It dropped out of an ascending pennant.
Cons:
SUPPORT RESISTANCE
Price support and resistance (whole number, chart levels, equal move)?
Indicator support and resistance?
Pros:
I thought 43.50 area was likely decent resistance and 43 decent target. I didn’t get all my shares filled at 43.02 maybe I should’ve used 43.05 but I was greedy.
Cons:
VOLUME
Greater on move and diminished on correction?
Euphoria and capitulation events?
Pros:
This was rather ideal looking 1 min base, though in hindsight this trades a bit choppy.
Cons:
PACE
Slower than average moves will often lead to continuations of the prior trend.
Stronger than average moves will tend to correct with slower ones.
Comparable moves near average will tend to lead to trading ranges.
Continuation bases tend to be 1 to 2x length of previous move.
Pros:
The only thing that made this not-ideal was the fact that there already was a large intraday move in the drop around 9.42a. I find this to be something to watch for a be careful as a lot of trades that seem to have nothing but pros will fill if there already was a wide intraday range move (especially compared to previous days).
Cons:
CORRRECTION PERIODS
Identify important correlations:
Pros:
Cons:
10.45a correction period was very close and I find I am better off not initiating new positions around that time.
PUTTING IT ALL TOGETHER
Gain or Loss:
Pros:
Trend
SR
Volume
Pace
Cons:
Correction Period
Things I did correctly:
My stop was pretty tight, I should take trades like this even though this didn’t work out. I think this was a sign of what turned out to be a slow choppy day.
Things I could have done better:
Even though in this case this would’ve been bad, I usually am better off trying more do or die for my price targets. Even if that means trades like this would take me out.
Areas I followed my plan and had good results:
This was an ok trade and I should take ones like this again.
Areas I didn’t follow my plan and had bad results:
Areas I followed my plan and had bad results:
Areas I didn’t follow my plan and had good results:
I bailed at 43.14 near 11a instead of trailing the stop wider.
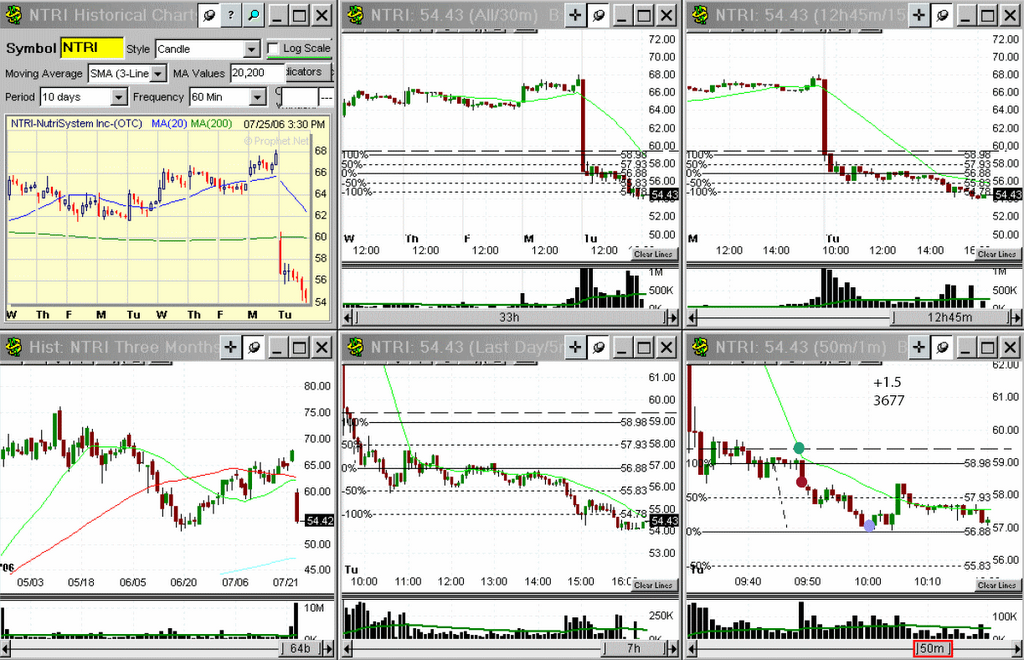
MAN:

TREND DEVELOPMENT:
Uptrend, downtrend or sideways trend?
3 waves, two waves with base then continuation or nothing?
Pros:
I suppose this was ok.
Cons:
SUPPORT RESISTANCE
Price support and resistance (whole number, chart levels, equal move)?
Indicator support and resistance?
Pros:
I thought 55.50 looked possible.
Cons:
VOLUME
Greater on move and diminished on correction?
Euphoria and capitulation events?
Pros:
Neutral.
Cons:
PACE
Slower than average moves will often lead to continuations of the prior trend.
Stronger than average moves will tend to correct with slower ones.
Comparable moves near average will tend to lead to trading ranges.
Continuation bases tend to be 1 to 2x length of previous move.
Pros:
Cons:
This is the biggest reason for this, this was rounding lows kept doing lower lows instead of an ascending pennant. Can see this was not a nice 1 min tight base.
CORRRECTION PERIODS
Identify important correlations:
Pros:
Cons:
Reversed tight at 3.05p correction period.
PUTTING IT ALL TOGETHER
Gain or Loss:
-1.04
Pros:
Trend
SR
Cons:
Pace
Correction Period
Things I did correctly:
Nothing.
Things I could have done better:
I shouldn’t have been trading this afternoon. I just couldn’t walk away from a loss day.
Areas I followed my plan and had good results:
Areas I didn’t follow my plan and had bad results:
This was not 1min setup at all.
Areas I followed my plan and had bad results:
Areas I didn’t follow my plan and had good results:
CBRL:

TREND DEVELOPMENT:
Uptrend, downtrend or sideways trend?
3 waves, two waves with base then continuation or nothing?
Pros:
There was a daily and 30min base, but it looked really choppy and bad. This was just a hope trade not a real setup.
Cons:
SUPPORT RESISTANCE
Price support and resistance (whole number, chart levels, equal move)?
Indicator support and resistance?
Pros:
Cons:
Retarded trade.
VOLUME
Greater on move and diminished on correction?
Euphoria and capitulation events?
Pros:
Cons:
Retarded trade.
PACE
Slower than average moves will often lead to continuations of the prior trend.
Stronger than average moves will tend to correct with slower ones.
Comparable moves near average will tend to lead to trading ranges.
Continuation bases tend to be 1 to 2x length of previous move.
Pros:
Cons:
This was just plain wrong. Again more of a descending pennant. I guess I can just revert to plain old bad trading.
CORRRECTION PERIODS
Identify important correlations:
Pros:
Cons:
Again I sold right at 3.05p correction period. Should’ve done these lousy trades with half risk.
PUTTING IT ALL TOGETHER
Gain or Loss:
-.2
Pros:
Trend
Cons:
SR
Volume
Pace
Correction Period
Things I did correctly:
Just got out when this looked really wrong.
Things I could have done better:
Areas I followed my plan and had good results:
Areas I didn’t follow my plan and had bad results:
Areas I followed my plan and had bad results:
Areas I didn’t follow my plan and had good results:
I bailed on this luckily. I do find when I take a totally wrong trade, that is like other wrong trades I have taken plenty of in the past, that it’s ok to bail on these. Like today I was pushing in the afternoon because I was thinking of money not because I was finding great trades or was trading well. Then I got in this and right away looked like I had done this old kind of trade I used to do, where it seemed I magically sold the low or bought the high of the day. I know what those wrong trades look like.
PNRA:

I’ll sum this up, can see again there was no 1min base. Choppy range. The 30min was decent for a base. The main con was my mental state, I was trading in the afternoon because I didn’t want to lose money, not because I was PNRA and it looked like some perfect trade that for sure was going to work out.
Posted by Chrisnyork at 8/01/2006 05:40:00 PM
0 comments Links to this post
|
|
|
 [复制链接]


 AMWD Trade: