- 金币:
-
- 奖励:
-
- 热心:
-
- 注册时间:
- 2006-7-3
|
|

楼主 |
发表于 2008-8-18 05:52
|
显示全部楼层

[TRANSLATED] INO TV - Member Only ... Sneak Peek
[TRANSLATED] INO TV - Member Only ... Sneak Peek
INO TV is a new service that streams over +1,000 hours of seminars for individual investor INO TV is a new service that streams over +1,000 hours of seminars for individual investors and traders. With over 500 titles, INO TV brings you Videos, MP3s and Workbooks from the most well known professionals in the financial arena. Investment seminars cost thousands to attend, we charge $99.95 for a whole year of unlimited seminar viewing from the comfort of your home!
Topics include: beginners, charting and analysis, trader psychology, trading systems, options trading, spread trading, day trading, money management, futures, stocks and currency trading... more
Top-Authors: Charles Le Beau, Walter Bressert, Barbara Rockefeller, Glen Ring, Jack Schwager, Ted Tesser...more
Check it out at http://tv.ino.com/premium/?vidmar and tune in to tune up your trading. (more) (less)
Added: 6 months ago
Views: 382
no rating
05:00
[TRANSLATED] 90 Second Futures (Commodities)
[TRANSLATED] 90 Second Futures (Commodities)
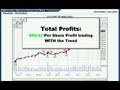
Adam Hewison, former floor trader and co-creator of MarketClub shows you how to trade futu Adam Hewison, former floor trader and co-creator of MarketClub shows you how to trade futures in 90 seconds. By identifying trend and timing points, you can enter in and out of markets making substantial profits and taking minimal losses.
Wheat -- March 2008 (CBOT_W.H08) -- $5,000 profit with one contract in 2007 (more) (less)
Added: 7 months ago
Views: 859

01:30
[TRANSLATED] 90 Second Stocks
[TRANSLATED] 90 Second Stocks
Adam Hewison, former floor trader and co-creator of MarketClub shows you how to trade stoc Adam Hewison, former floor trader and co-creator of MarketClub shows you how to trade stocks in 90 seconds. By identifying trend and timing points, you can enter in and out of markets making substantial profits and taking minimal losses.
Apple (NASDAQ: AAPL) -- 80% profitable trades in 2007 (more) (less)
Added: 7 months ago
Views: 357
no rating
01:29
[TRANSLATED] Developing a Premium Portfolio -...
[TRANSLATED] Developing a Premium Portfolio -- Part 3 of 3
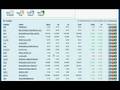
Brad Stafford of INO.com explains two methods of filtering for equities, futures, and fore Brad Stafford of INO.com explains two methods of filtering for equities, futures, and forex. He explains two tactics -- 1) technical filtering and 2) external source filtering.
Technical -- use the trend analysis score to get a general feel and identify the trend strength and direction . Next use technical indicators and MarketClub's Trade Triangle technology to identify trend, momentum, overbought/oversold conditions and other market conditions.
External Source -- Our news portfolio will allow you to search for news applicable to your open positions or markets on your watch list. This is a feature that will update you with the latest commentary, recaps and alert you of breaking headlines on the company, sector or currency you track.
By using these two filtering techniques you can better identify proper points of entry and safely navigate the market. If you have any questions please contact Brad Stafford at 1-800-538-7424 ext. 109 or email him at Support@ino.com .
We also encourage you to visit INO.com's Traders Blog at http://club.ino.com/trading/?videomar (more) (less)
Added: 8 months ago
Views: 319
08:52
[TRANSLATED] Developing a Premium Portfolio: ...
[TRANSLATED] Developing a Premium Portfolio: Video Lesson Part 2 of 3
Dear Trader, Last week I uploaded part 1 in the video lesson series,Developing a Premiu Dear Trader,
Last week I uploaded part 1 in the video lesson series,Developing a Premium Portfolio and today you're getting part 2!
Confidence in the securities you are trading is crucial to your strategy. By focusing on two main points, knowledge and technical analysis, traders will learn exactly what it takes to have confidence in the symbols you trade.
I personally have gotten some great tips that I wish I knew when I first began trading...and even into the later years of my trading!
Symbols covered: Apple (NASDAQ:AAPL), Euro vs. US Dollar (FOREX:EURUDS), Wal-mart (NYSE:WMT)
Have a great trading week,
Brad Stafford
Affiliate Director
INO.com
P.S. In case you missed part 1, here it is again:
http://broadcast.ino.com/videos/premium_portfolio/?youtube (more) (less)
Added: 8 months ago
Views: 418
08:42
| 
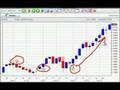
[TRANSLATED] Can you learn to trade crude oil...
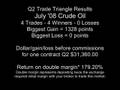
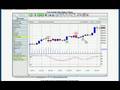
[TRANSLATED] Can you learn to trade crude oil in 90 seconds?
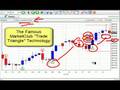
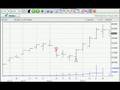
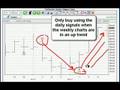
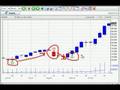
Adam Hewison, president of INO.com and co-creator of MarketClub shows you how to analyze t Adam Hewison, president of INO.com and co-creator of MarketClub shows you how to analyze the crude oil market in 90 seconds flat by using MarketClub's proprietary "Trade Triangle" technology.
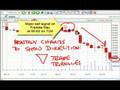
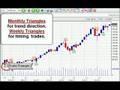
When looking at the crude oil market we use the weekly triangles to identify trend (also possible initial entry). We can see that the January '08 contract has been in a negative weekly trend since late November. Therefore, we would only be taking short positions.
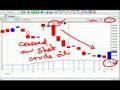
We would use our daily "Trade Triangles" for timing. We use corresponding triangles as entry points and non-corresponding triangles as exit points.
The "Trade Triangle" technology helps traders enter markets after a steady trend has been established and only exit after the trend has come to a complete halt. This proprietary study can provide as a great tool in conjunction with other technical indicators of your choice. MarketClub also gives you access to multiple scans, historical data, news portfolio and a whole lot more.
If you are a member consider this video a quick refresher. If you're not a member, join today and learn how MarketClub and our "Trade Triangle" technology can help you hunt down profits in crude oil.
It only takes 90 seconds to sign-up for your 30-day risk free trial!
Visit http://club.ino.com/trading/?vidmar for more videos from INO.com (more) (less)
Added: 8 months ago
Views: 2,120
01:16
[TRANSLATED] Developing a Premium Portfolio: ...
[TRANSLATED] Developing a Premium Portfolio: Video Lesson Part 1 of 3
Trader, This video covers the first step in helping you create a diverse portfolio! D Trader,
This video covers the first step in helping you create
a diverse portfolio! Diversity is the one thing that ALL
successful traders' portfolios have in common. The
video proves that developing a diverse and profitable
portfolio is not as hard as it seems!
So please watch part 1 in this 3 part video lesson series.
Please visit http://club.ino.com/trading/?vidmar for more videos on equities, futures, forex, options and other helpful investing tips. (more) (less)
Added: 8 months ago
Views: 554
04:25
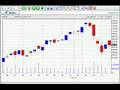
[TRANSLATED] Learn How To Trade The Forex Mar...
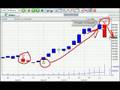
[TRANSLATED] Learn How To Trade The Forex Markets In 90 Seconds
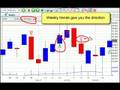
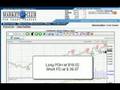
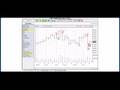
Adam Hewison, president of INO.com and co-creator of MarketClub shows you how to analyze t Adam Hewison, president of INO.com and co-creator of MarketClub shows you how to analyze the Forex market in 90 seconds flat by using MarketClub's proprietary "Trade Triangle" technology.
When looking at the foreign exchange markets we use the weekly triangle to identify trend (also possible initial entry). We can see that the EURUSD has been in a positive weekly trend since early September. Therefore, we would only be taking long position.
We would use our daily triangles for timing. We use corresponding triangles as entry points and non-corresponding triangles as exit points. In about 1 month we turned this into a 427 pip profit.
The "Trade Triangle" technology helps traders enter markets after a steady trend has been established and only exit after the trend has come to a complete halt. This proprietary study can provide as a great tool in conjunction with other technical indicators of your choice. MarketClub also gives you access to multiple scans, historical data, news portfolio and more.
If you are a member consider this a quick refresh. If you're not a member, join today and learn how MarketClub and the "Trade Triangle" technology can help you profit in the FOREX markets.
It only takes 90 seconds to sign-up for your 30-day risk free trial!
For more videos and lessons visit http://club.ino.com/trading/?vidmar (more) (less)
Added: 9 months ago
Views: 6,853
01:34
[TRANSLATED] Research In Motion (Symbol RIMM)
[TRANSLATED] Research In Motion (Symbol RIMM)
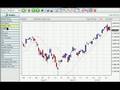
Watch over Adam Hewison's shoulder as he analyzes Research In Motion's stock (symbol: rimm Watch over Adam Hewison's shoulder as he analyzes Research In Motion's stock (symbol: rimm). Rimm, Google and Apple were the Titan's of Tech, however with the recent "Tech Meltdown" how will these markets fair?
Hewison is a former floor trader and advisor specializing in futures and foreign exchange. He is president of http://www.ino.com and co-creator of http://marketclub.com. Hewison is also a technical analyst and commentator for Bloomberg, CNBC and MarketWatch.
Visit INO.com's TradersBlog at http://club.ino.com/trading/?vidmar (more) (less)
Added: 9 months ago
Views: 627
01:47
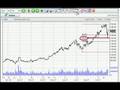
[TRANSLATED] Apple's Stock Analyzed (Symbol A...
[TRANSLATED] Apple's Stock Analyzed (Symbol AAPL)
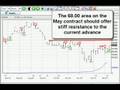
Watch over Adam Hewison's shoulder as he analyzes Apple's stock (symbol: aapl). Where are Watch over Adam Hewison's shoulder as he analyzes Apple's stock (symbol: aapl). Where are the support and resistant levels as APPL moves into a trading range? How far will we drop, or more importantly how long will a sideways move last?
Hewison is a former floor trader and advisor specializing in futures and foreign exchange. He is president of http://www.ino.com and co-creator of http://marketclub.com. Hewison is also a technical analyst and commentator for Bloomberg, CNBC and MarketWatch.
Visit INO.com's TradersBlog at http://club.ino.com/trading/?vidmar (more) (less)
Added: 9 months ago
Views: 630
02:39
| 
[TRANSLATED] Google's Stock Analyzed (Symbol ...
[TRANSLATED] Google's Stock Analyzed (Symbol GOOG)
Watch over Adam Hewison's shoulder as he analyzes Google's stock (symbol: goog). Where are Watch over Adam Hewison's shoulder as he analyzes Google's stock (symbol: goog). Where are the support and resistant levels as GOOG moves into a trading range opposed to a trending range? How long will we move sideways before goog starts to test the lows again.
Hewison is a former floor trader and advisor specializing in futures and foreign exchange. He is president of http://www.ino.com and co-creator of http://marketclub.com. Hewison is also a technical analyst and commentator for Bloomberg, CNBC and MarketWatch.
Visit INO.com's TradersBlog at http://club.ino.com/trading/?vidmar (more) (less)
Added: 9 months ago
Views: 371
02:05
[TRANSLATED] Lesson 3- Bollinger Bands
[TRANSLATED] Lesson 3- Bollinger Bands
The Bollinger Bands were created by John Bollinger in the late 1980s. Bollinger studied mo The Bollinger Bands were created by John Bollinger in the late 1980s. Bollinger studied moving averages and experimented with a new envelope (channel) indicator. This study was one of the first to measure volatility as a dynamic movement. This tool provides a relative definition of price highs/lows in terms of upper and lower bands.
The Bollinger Bands are comprised of three smooth lines. The middle line is the simple moving average, normally set as a period of 20 (number of bar/ticks in a given time period), and is used as a base to create upper/lower bands. The upper band is the middle band added to the given deviation multiplied by a given period moving average. The lower band is the middle band subtracted by the given deviation multiplied by a given period moving averages.
What can I use this for?
1.Trend -- When price moves outside of the bands, it is believed that the current trend will continue.
2.Volatility- The band will expand/contract as the price movement becomes more volatile/or becomes bound into tight trading patterns, respectively.
3.Determine Oversold/Overbought Conditions -- When price continues to hit upper band, the price is deemed overbought (may suggest sell). When price continues to hit lower band, the price is deemed oversold (may suggest buy).
You can use the Bollinger Bands tool in the studies column of the MarketClub charting applet. Select Bollinger Bands study and enter the standard deviation and the period (default/recommended settings: deviation -- 2.0 and period of 20). As you move your chart through time variations, the Bollinger Bands will automatically recalculate and re-chart.
For more info visit http://club.ino.com/trading/youtube/ (more) (less)
Added: 9 months ago
Views: 9,975
06:17
[TRANSLATED] Lesson 2- Moving Averages
[TRANSLATED] Lesson 2- Moving Averages
Moving averages are one of the most basic tools in technical analysis. The moving averages Moving averages are one of the most basic tools in technical analysis. The moving averages are a lagging indicator and do not predict trend, but confirm trend once it has been established. The calculations smooth out day-to-day price fluctuations and reduce noise.
You can use moving averages in simple, exponential or weighted form.
1.Simple -- computes the averages (mean) of the closing price over the chosen amount of periods (tick/bars) and displays in a joined smooth curving line. Short term: 10-30 days, Intermediate term: 30-100 days, Long term: 100-200+. Sum of all closing prices divided by number of closing prices in specific period.
2.Exponential -- applies more weight to recent prices in comparison older prices. Found by applying a percentage of today's closing price to yesterday's closing moving averages.
3.Weighted -- gives current data more weight than older data. Older data is considered of less value/significance. Each price in a series is multiplied by the number of periods preceding it: the old the price the smaller its multiplier.
What can I use this for? The moving averages can be used for various task, but it is suggested that they are used with other technical indicators. The great thing about moving averages is that they simplify data for the eyes.
1.Support -- look for price reversing when it moves close to a longer term moving average line.
2.Resistance- when the price comes close to the line of moving average, traders will sell in hopes of taking profits at the top of a natural resistance level.
3.Crossover -- Moving averages can be used as basic buy/sell points by detecting crossovers when the moving averages line crosses above and below the price bars
4.Crossover on Moving Average Ribbons -- When two different moving averages crossover one another, this can signal a possible reversal.
You can use MarketClub to analyze moving average. Select the studies list and choose moving averages. You can add, delete or cancel various moving average. Simply fill in period, and choose moving average form. Repeat previous steps if you would like to add multiple moving averages.
If you are interested in moving average you may also want to study the ADX indicator. (more) (less)
Added: 9 months ago
Views: 6,384
05:29
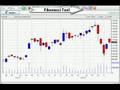
[TRANSLATED] Lesson 1 -- Fibonacci Number Seq...
[TRANSLATED] Lesson 1 -- Fibonacci Number Sequence
The Fibonacci Sequence is most likely the most influential series of numbers in the world The Fibonacci Sequence is most likely the most influential series of numbers in the world. It is also likely that you encounter the numerical pattern everyday. This mathematical series was discovered by Leonardo Fibonacci of Pisa in the early thirteenth century and was outlined in his book, Book of Calculations. 1, 1, 2, 5, 8, 13, 21, 34, 55, etc. are the "golden" numbers that are found in geometry, art, anatomy, music, biology, botany, conchology, and even trading. After the two starting values, each following number is the sum of the two proceeding numbers. Fn=Fn-1 + Fn-2
How does this relate to trading? The ratio of any number to the next larger number of the sequence is 62% (or specifically 61.8%), the "Golden" ratio. The inverse of that Fibonacci ratio is 38% (or specifically 38.2%). Mathematical psychologist, Vladimir Lefebvre suggested that traders exhibit positive and negative evaluations of the opinions they hold about the market. These negative and positive evaluations have direct correlation with the retracement percentage seen in market analysis.
You can use the Fibonacci tool on MarketClub's Java Charting Applet by clicking on the high points and most recent/major low. This will plot three ruling lines that represent a 38%, 50% and 62% markings between the chosen high and low points. These levels can help traders identify pullbacks/retracements. As you move through different time periods, the Fibonacci lines will readjust to fit various data constructs. It is possible to use this function regardless of market trend direction. The Fibonacci tools is also useful to analyze equities, futures, forex and precious metal markets.
If you are interested the Fibonacci Sequence you may also want to obtain more information on Elliot Wave and W. D. Gann. (more) (less)
Added: 9 months ago
Views: 13,284
06:49
[TRANSLATED] Sub-Prime, submarines, and the f...
[TRANSLATED] Sub-Prime, submarines, and the fear of the unknown
During World War II, German submarines known as U-boats scoured the shipping lanes of the During World War II, German submarines known as U-boats scoured the shipping lanes of the North Atlantic looking to torpedo merchant vessels bringing much needed war relief to England. Hundreds of ships, and thousands of brave men met their fate in the icy waters of the North Atlantic.
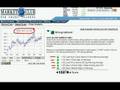
What have submarines got to do with the current sub-prime disaster? Well the key back in WWII was you couldn't see the torpedoes until it was too late. It seems to this market observer that the sub-prime like those WWII subs remain hidden and companies don't realize that they have been torpedoed until it's too late. E-Trade is a perfect example and the latest sub-prime victim, as it's stock got hammered on November 12th.
Many analysts are openly speculating that E-Trade might declare bankruptcy!
The economic unknown to the markets and the big fear for everyone is how many more torpedoes are lurking out there in the portfolios of banks and institutions?
So what's an investor to do?
Well, the best way to avoid disasters like Structured Investment Vehicles (SIVs), Collateralized Debt Obligations (CDOs) is to learn how to avoid them. This short, four minute video trading lesson, will show you the exact rules you need to follow to avoid meltdowns in the future. It will also show you how you can even profit from disasters like E-Trade. Watch it as our guest. No registration required.
Visit the TradersBlog at http://club.ino.com/trading/vidmar/ (more) (less)
Added: 9 months ago
Views: 1,737
04:47
| 
[TRANSLATED] Video Lesson #5 -- Using Parabol...
[TRANSLATED] Video Lesson #5 -- Using Parabolic SAR To Set Stop Losses
The Parabolic SAR is a great technical analysis tool used to set stop losses, identify tre The Parabolic SAR is a great technical analysis tool used to set stop losses, identify trend and spot immediate reversals. This popular technical analysis tool is among the 18 studies that can be applied to MarketClub's charting applet. Created by Wells, this tool calculates acceleration, extreme points and projected points to place dots that can guide various trading decisions. (more) (less)
Added: 9 months ago
Views: 1,740
04:23
[TRANSLATED] Video Lesson: Crude Oil at $50 ...
[TRANSLATED] Video Lesson: Crude Oil at $50 ... Yikes
What a week. Crude trades over 95 a barrel, gold hits new highs and Google breaks over $70 What a week. Crude trades over 95 a barrel, gold hits new highs and Google breaks over $700 a share. On top of all that, the Fed cuts rates by a quarter point, giving the market what it wants and stocks crater on Thursday.
So what's ahead ... more volatility?
Perhaps...or perhaps Crude at 50?!
In reality Crude is around the 50 mark, but not here...and why not? Watch
the streaming Video Lesson "Crude Oil at $50 ... Yikes!" that explains why Crude is where it is and where it COULD end up.
For more free trading lessons visit http://club.ino.com/trading/vidmar/ (more) (less)
Added: 9 months ago
Views: 765
03:36
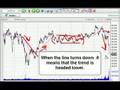
[TRANSLATED] Video Lesson: Trend Identificati...
[TRANSLATED] Video Lesson: Trend Identification and Utilization
It's been proven that it doesn't matter if you're day, swing, or position trading the key It's been proven that it doesn't matter if you're day, swing, or position trading the key is to trade with the trend. Trend trading has been utilized for many years by professionals, intermediates, and novice traders alike who follow the trend with success. But why do they trade the trend and how do they find the trend?
The hardest part...Finding the Trend! The easiest part...Trading the Trend! Take a few minutes and look at this streaming video lesson titled, "Why to Trade the Trend and How to Find the Trend." (more) (less)
Added: 9 months ago
Views: 1,445
08:58

[TRANSLATED] Diversification -- An Investor's...
[TRANSLATED] Diversification -- An Investor's Muscles
Stocks, bonds, the make-up of a typical portfolio... it's easily broken. But when you u Stocks, bonds, the make-up of a typical portfolio... it's easily broken.
But when you use stocks, bonds, commodities, foreign exchange, precious metals, you diversify your portfolio giving it a powerful strength that can not be broken. Diversification is very important for every investor.
Diversification is good.
It's easy to diversify with MarketClub.com
Learn more at http://club.ino.com/join/?vidmar (more) (less)
Added: 9 months ago
Views: 498
no rating
00:32
[TRANSLATED] Black Monday 20th Anniversary --...
[TRANSLATED] Black Monday 20th Anniversary -- Are You Nervous?
No doubt about it, a lot of traders are nervous this week. Why? It could be because No doubt about it, a lot of traders are nervous this week.
Why?
It could be because this week is the 20th anniversary of BLACK MONDAY the crash of '87.
Many watching this video may be too young to remember the biggest single day drop in the history of the Dow Jones Industrial Average. On the 19th of October 1987, the Dow dropped a jaw dropping 23% in one day.
In case you are wondering the biggest single day crash in 1929 was 12.9% on October 28th 1929.
Can it happen again?
That's the question BARRONS posed on the front page of its weekly newspaper.
In the current poll we are conducting on our BLOG- http://club.ino.com/trading/?vidmar , and we ask that questions, "Can It Happen Again?"
I have just completed a new video to show how you can protect yourself no matter what happens to the market.
Be prepared this could be the most dangerous week of the year. This could be the week that makes or breaks your year.
Visit the TradersBlog- (paste URL into browser) http://club.ino.com/trading/?vidmar and read about Black Monday for yourself. (more) (less)
Added: 10 months ago
Views: 2,193
07:05
|
Previous 1 2 3 Next |
|
|
 [复制链接]